This site uses cookies to improve your experience. To help us insure we adhere to various privacy regulations, please select your country/region of residence. If you do not select a country, we will assume you are from the United States. Select your Cookie Settings or view our Privacy Policy and Terms of Use.
Cookie Settings
Cookies and similar technologies are used on this website for proper function of the website, for tracking performance analytics and for marketing purposes. We and some of our third-party providers may use cookie data for various purposes. Please review the cookie settings below and choose your preference.
Used for the proper function of the website
Used for monitoring website traffic and interactions
Cookie Settings
Cookies and similar technologies are used on this website for proper function of the website, for tracking performance analytics and for marketing purposes. We and some of our third-party providers may use cookie data for various purposes. Please review the cookie settings below and choose your preference.
Strictly Necessary: Used for the proper function of the website
Performance/Analytics: Used for monitoring website traffic and interactions
This article is part of a series exploring a workshop guiding you through the open source project Fluent Bit, what it is, a basic installation, and setting up the first telemetry pipeline project. Are you ready to get started with cloud-native observability and telemetry pipelines?
I used a "getting started" workshop to guide you through this series and to provide a hands-on experience for those new to visualizing observability data. In the previous article , I kicked off with an introduction to and installation of Perses and provided links to the actual online workshop content.
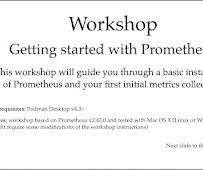
This workshop is for you, designed to expand your knowledge and understanding of open-source observability tooling that is available to you today. Dive right into a free, online, self-paced, hands-on workshop introducing you to Prometheus. Are you interested in open-source observability, but lack the knowledge to just dive right in?
This workshop is for you, designed to expand your knowledge and understanding of open-source observability tooling that is available to you today. Dive right into a free, online, self-paced, hands-on workshop introducing you to Prometheus. Are you interested in open-source observability, but lack the knowledge to just dive right in?
I used a getting started workshop (linked below) to guide you through this series and to provide a hands-on experience for those new to visualizing observability data. Back in December of 2022, I started a series taking you on a tour of the Perses project.
I used a getting started workshop to guide you through this series and to provide a hands-on experience for those new to visualizing observability data. In a previous article , you began creating your first-ever basic Perses dashboard and I provided links to the actual online workshop content.
This workshop is for you, designed to expand your knowledge and understanding of open-source observability tooling that is available to you today. Are you looking to get away from proprietary instrumentation? Are you interested in open-source observability but lack the knowledge to just dive right in?
This workshop is for you, designed to expand your knowledge and understanding of open-source observability tooling that is available to you today. Are you interested in open-source observability but lack the knowledge to just dive right in?
With all the technology changes through the past three years, with the world moving to K8s, the rise of GitOps, everything as code, event-driven automation, and many new open standards in the cloud-native space, it was time to update our workshop. Last week we kicked it off with a three-hour virtual hands-on workshop.
This workshop is for you, designed to expand your knowledge and understanding of open-source observability tooling that is available to you today. Are you looking to get away from proprietary instrumentation? Are you interested in open-source observability but lack the knowledge to just dive right in?
This workshop is for you, designed to expand your knowledge and understanding of open-source observability tooling that is available to you today. Dive right into a free, online, self-paced, hands-on workshop introducing you to Prometheus. Are you interested in open-source observability but lack the knowledge to just dive right in?
This article is part of a series exploring a workshop guiding you through the open source project Fluent Bit, what it is, a basic installation, and setting up the first telemetry pipeline project. Are you ready to get started with cloud-native observability with telemetry pipelines?
This article is part of a series exploring a workshop guiding you through the open source project Fluent Bit, what it is, a basic installation, and setting up the first telemetry pipeline project. Are you ready to get started with cloud-native observability with telemetry pipelines?
I used a getting started workshop to guide you through this series and to provide a hands-on experience for those new to visualizing observability data. In a previous article , I took you through the Perses specification and provided links to the actual online workshop content.
I used a getting started workshop to guide you through this series and to provide a hands-on experience for those new to visualizing observability data. I provided links to the actual online workshop content. These articles covered this fairly new open dashboard and visualization project targeting cloud-native environments.
If so, this workshop is for you, designed to expand your knowledge and understanding of open-source observability tooling that is available to you today. Are you looking to get away from proprietary instrumentation? Are you interested in open-source observability but lack the knowledge to just dive right in?
New Smashing Workshops on Front-End & Design. New Smashing Workshops on Front-End & Design. You might know it already, but perhaps not yet: we regularly run friendly online workshops around front-end and design. All workshops sessions are broken down into 2.5h-segments Upcoming Live Workshops (Aug–Oct 2021).
This article is part of a series exploring a workshop guiding you through the open source project Fluent Bit, what it is, a basic installation, and setting up the first telemetry pipeline project. Are you ready to get started with cloud-native observability with telemetry pipelines?
This workshop is for you, designed to expand your knowledge and understanding of open-source observability tooling that is available to you today. Are you looking to get away from proprietary instrumentation? Are you interested in open-source observability but lack the knowledge to just dive right in?
Everything discussed here is supported by a hands-on, self-paced workshop authored by Paige Cruz. By the end of this series, you'll have an understanding of how telemetry travels from your applications to the OpenTelemetry Collector, and be ready to bring OpenTelemetry to your future projects.
I will also refer the reader to the latest version of the Unified Observability in Grafana Workshop that has just been published which demonstrates the principles, provides code and configuration examples, etc. All of the code for the workshop can also be found at the [link] repos (specifically in the observability directory).
Upcoming Live Workshops On Front-End & UX (Oct 2021–Jan 2022). Upcoming Live Workshops On Front-End & UX (Oct 2021–Jan 2022). There are fantastic video courses out there, yet online workshops are just different. That’s why we break workshops down into 2.5h-sessions Free Smashing Workshop.
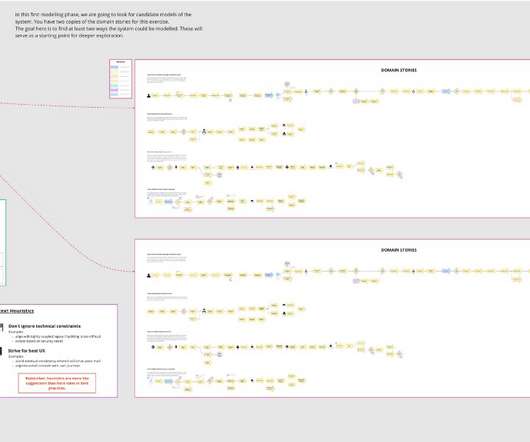
Recently I ran a fully remote, 2 full-day, Strategic Domain-Driven Design workshop using Miro. I knew that I didn’t want the online workshop to be a poor version of the in-person training. The Bounded Context Canvas As we progress through the workshop, we add more information to the canvas. This was necessitated by Covid.
Smashing Workshops: Winter 2021. Smashing Workshops: Winter 2021. That’s why we break our online Smashing workshops down into 2.5h-sessions Our online workshops take place live and span multiple days across weeks. Jump to all workshops ?. Iris Lješnjanin. 2021-11-22T16:00:00+00:00. 2021-11-22T20:34:08+00:00.
Free Online Workshop: Frustrating Design Patterns And How To Fix Them. Free Online Workshop: Frustrating Design Patterns And How To Fix Them. Join us for a free online workshop on Frustrating Design Patterns on Monday, September 27 at 9:00 AM PDT / 6PM CET. Register for the free workshop. Vitaly Friedman. Infinite scroll.
Finally, I walked you through the open-source visualization and dashboard project called Perses by introducing my hands-on workshop. I continued onwards with a few of the architectural challenges you might encounter when older monolithic applications and monitoring tools are still part of an organization's infrastructure landscape.
New Smashing Online Workshops on Front-End & UX. New Smashing Online Workshops on Front-End & UX. You might know it already, but perhaps not yet: we regularly run friendly online workshops around front-end and design. All workshops sessions are broken down into 2.5h-segments Upcoming Live Workshops (Sep–Nov 2021).
In a recent workshop I did with a global player in the financial market we used their new mobile banking app as a reference. In the workshop, I also answered the question: How can we measure those metrics (=SLIs) that are behind our objectives? In my workshop, I showed typical SLO dashboards I build.
I was eager to take part in a recent Digital Government Institute workshop, “ Demystifying Artificial Intelligence.” During this workshop, I offered the following recommendations to clear up uncertainty around AI and replace it with trust: Focus on the mission.
Back in the summer I shared some of the techniques I’d been using to reimagine my in-person architecture workshops as remote digital offerings with Miro. My typical workshops usually range from 2 half days to 6 half days in duration spread over the course of 1–2 weeks. They’re a mixture of lectures and hands-on exercises. Works fine.
As the year progressed , we never stopped our marketing alignment with Red Hat , f rom executing our joint go- to – market white paper, many webinars, workshops, and my personal favorite , “Virtual Cocktail Series.” I n a world that was anything but normal, i t was remarkable how quickly we were able to pivot.
Everything discussed here is supported by a hands-on, self-paced workshop authored by Paige Cruz. By the end of this series, you'll have an understanding of how telemetry travels from your applications to the OpenTelemetry Collector, and be ready to bring OpenTelemetry to your future projects.
With this partnership, our customers can also expect events, product tutorials, and customer solutions workshops in the near future. “We This enables teams to proactively resolve anomalies, often before they impact users, and provides AI-powered insights that improve release confidence.
Everything discussed here is supported by a hands-on, self-paced workshop authored by Paige Cruz. By the end of this series, you'll have an understanding of how telemetry travels from your applications to the OpenTelemetry Collector, and be ready to bring OpenTelemetry to your future projects.
Everything discussed here is supported by a hands-on, self-paced workshop authored by Paige Cruz. By the end of this series, you'll have an understanding of how telemetry travels from your applications to the OpenTelemetry Collector, and be ready to bring OpenTelemetry to your future projects.
Everything discussed here is supported by a hands-on, self-paced workshop authored by Paige Cruze. By the end of this series, you'll have an understanding of how telemetry travels from your applications to the OpenTelemetry Collector, and be ready to bring OpenTelemetry to your future projects.
Everything discussed here is supported by a hands-on, self-paced workshop authored by Paige Cruze. By the end of this series, you'll have an understanding of how telemetry travels from your applications to the OpenTelemetry Collector, and be ready to bring OpenTelemetry to your future projects.
David will also talk at the Workshop on Education and Practice of Performance Engineering (WEPPE) about Performance Engineering and Database Development at MongoDB. As well as we will have the Performance Testing in DevOps panel at the Load Testing and Benchmarking workshop where I would be one of the panelist.
Everything discussed here is supported by a hands-on, self-paced workshop authored by Paige Cruz. By the end of this series, you'll have an understanding of how telemetry travels from your applications to the OpenTelemetry Collector, and be ready to bring OpenTelemetry to your future projects.
Everything discussed here is supported by a hands-on, self-paced workshop authored by Paige Cruz. By the end of this series, you'll have an understanding of how telemetry travels from your applications to the OpenTelemetry Collector, and be ready to bring OpenTelemetry to your future projects.
We organize all of the trending information in your field so you don't have to. Join 5,000+ users and stay up to date on the latest articles your peers are reading.
You know about us, now we want to get to know you!
Let's personalize your content
Let's get even more personalized
We recognize your account from another site in our network, please click 'Send Email' below to continue with verifying your account and setting a password.


Let's personalize your content