This site uses cookies to improve your experience. To help us insure we adhere to various privacy regulations, please select your country/region of residence. If you do not select a country, we will assume you are from the United States. Select your Cookie Settings or view our Privacy Policy and Terms of Use.
Cookie Settings
Cookies and similar technologies are used on this website for proper function of the website, for tracking performance analytics and for marketing purposes. We and some of our third-party providers may use cookie data for various purposes. Please review the cookie settings below and choose your preference.
Used for the proper function of the website
Used for monitoring website traffic and interactions
Cookie Settings
Cookies and similar technologies are used on this website for proper function of the website, for tracking performance analytics and for marketing purposes. We and some of our third-party providers may use cookie data for various purposes. Please review the cookie settings below and choose your preference.
Strictly Necessary: Used for the proper function of the website
Performance/Analytics: Used for monitoring website traffic and interactions
How To Design For High-Traffic Events And Prevent Your Website From Crashing How To Design For High-Traffic Events And Prevent Your Website From Crashing Saad Khan 2025-01-07T14:00:00+00:00 2025-01-07T22:04:48+00:00 This article is sponsored by Cloudways Product launches and sales typically attract large volumes of traffic.
Before a new version of the application is deployed, the software is subject to a series of load tests that evaluate capacity and performance under a series of simulated traffic and application demands. These metrics are latency, traffic, errors, and saturation, all of which must be key considerations when curating user experience.
Incremental Backups: Speeds up recovery and makes data management more efficient for active databases. Optimized Queries: Eliminates redundant IS NOT NULL checks, speeding up query execution for columns that cant contain null values. Improved Vacuuming: A redesigned memory structure lowers resource use and speeds up the vacuum process.
Our Flink configuration includes 8 task managers per region, each equipped with 8 CPU cores and 32GB of memory, operating at a parallelism of 48, allowing us to handle the necessary scale and speed for seamless performance delivery. Thus, all data in one region is processed by the Flink job deployed within thatregion.
The system could work efficiently with a specific number of concurrent users; however, it may get dysfunctional with extra loads during peak traffic. Performances testing helps establish the scalability, stability, and speed of the software application. Confirming scalability, dependability, stability, and speed of the app is crucial.
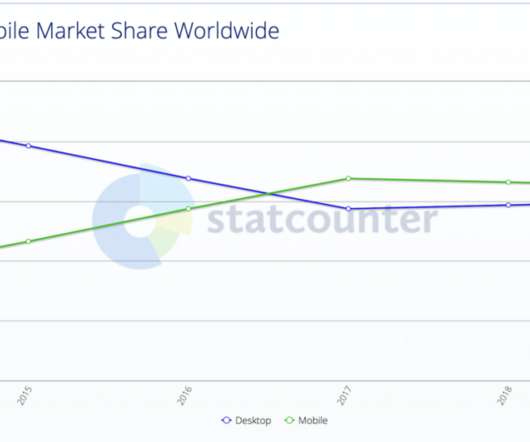
Google has a pretty tight grip on the tech industry: it makes by far the most popular browser with the best DevTools, and the most popular search engine, which means that web developers spend most of their time in Chrome, most of their visitors are in Chrome, and a lot of their search traffic will be coming from Google. Why This Is a Problem.
Caching is the process of storing frequently accessed data or resources in a temporary storage location, such as memory or disk, to improve retrieval speed and reduce the need for repetitive processing.
Over the last two month s, w e’ve monito red key sites and applications across industries that have been receiving surges in traffic , including government, health insurance, retail, banking, and media. The following day, a normally mundane Wednesday , traffic soared to 128,000 sessions. Media p erformance .
In the fourteen years that I've been working in the web performance industry, I've done a LOT of research, writing, and speaking about the psychology of page speed – in other words, why we crave fast, seamless online experiences. In fairness, that was in the early 2000s, and site speed was barely on anyone's radar.
To address potentially high numbers of requests during online shopping events like Singles Day or Black Friday, it’s crucial that this online shop have a memory storage strategy that allows for speed, scaling, and resilience of all microservices, especially the shopping cart service.
As organizations digitally transform, they’re also accelerating the speed of software delivery. It encompasses factors such as page loading speed, responsiveness, and overall ease of use during the checkout process, optimizing user satisfaction and minimizing cart abandonment. for the workout video playback feature.
Kafkas proprietary protocol is optimized for high-speed data transfer, ensuring minimal latency and efficient message distribution. However, performance can decline under high traffic conditions. However, its lack of support for standardized messaging protocols may require additional integration effort in heterogeneous environments.
This speeds up your teams’ mean time to identify (MTTI) issues and repair (MTTR), increasing business resiliency to disruptions. ActiveGate also optimizes traffic volume in your network and serves as a secure relay layer in protected networks and DMZs.
Other observability solutions don’t provide the required automation capabilities that would allow: Automating and speeding up the SLO validation process and quickly reacting to regressions detected in application topology. Informing the right people with the answers they need to implement targeted countermeasures.
In turn, IAC offers increased deployment speed and cross-team collaboration without increased complexity. But this increased speed can’t come at the expense of control, compliance, and security. Making the move to IAC offers multiple benefits, including the following: Speed.
Google do strongly encourage you to focus on site speed for better performance in Search, but, if you don’t pass all relevant Core Web Vitals (and the applicable factors from the Page Experience report) they will not push you down the rankings. All Core Web Vitals data used to rank you is taken from actual Chrome-based traffic to your site.
In today’s world, the speed of innovation is key to business success. WAFs protect the network perimeter and monitor, filter, or block HTTP traffic. Compared to intrusion detection systems (IDS/IPS), WAFs are focused on the application traffic. Dynatrace news. Unfortunately, they also introduce risk.
IoT is transforming how industries operate and make decisions, from agriculture to mining, energy utilities, and traffic management. They enable real-time tracking and enhanced situational awareness for air traffic control and collision avoidance systems. The ADS-B protocol differs significantly from web technologies.
With today’s high expectations for the speed and availability of applications, you need a deep understanding of real user experiences to make the best business decisions. Dynatrace news. Dynatrace automatically detects if an HTTP monitor is running against a service that is already monitored by OneAgent and links them together.
Data collected on page load events, for example, can include navigation start (when performance begins to be measured), request start (right before the user makes a request from the server), and speed index metrics (measure page load speed). RUM, however, has some limitations, including the following: RUM requires traffic to be useful.
” Moreover, as modern DevOps practices have increased the speed of software delivery, more than two-thirds (69%) of chief information security officers (CISOs) say that managing risk has become more difficult. Scanning the runtime environment of your services can help to identify unusual network traffic patterns.
Answering Common Questions About Interpreting Page Speed Reports Answering Common Questions About Interpreting Page Speed Reports Geoff Graham 2023-10-31T16:00:00+00:00 2023-10-31T17:06:18+00:00 This article is sponsored by DebugBear Running a performance check on your site isn’t too terribly difficult. Source: Source: DebugBear.
Microservices-based architectures and software containers enable organizations to deploy and modify applications with unprecedented speed. Maintaining reliable uptime and consistent service quality has become more complex as organizations expand their computing footprints across multiple data centers and in the cloud.
Using a page speed optimization audit tool like GTmetrix or WebPageTest is a great first step towards assessing how your website loads for visitors. However, you may be making one of the common page speed testing mistakes that often cost website owners engagement, and ultimately, revenue. Mistake #1: Only Testing Desktop.
What was once an onslaught of consumer traffic between Black Friday and Cyber Monday has turned into a weeklong event, with most retailers offering deals well ahead of Black Friday. This had the effect of dramatically speeding up its performance and reducing support costs.
Since instances of both CentOS and Ubuntu were running in parallel, I could collect flame graphs at the same time (same time-of-day traffic mix) and compare them side by side. Measuring the speed of time Is there already a microbenchmark for os::javaTimeMillis()? The CentOS flame graph: The Ubuntu flame graph: Darn, they didn't work.
While digital experience has many facets, transaction speed usually ranks among the most important. IT teams spend months preparing for the peak traffic they anticipate will arrive with holiday shopping. From first to lasting impressions But there’s more to digital experience than speed.
Measuring application performance is increasingly important because as organizations digitally transform, they’re also accelerating the speed of software delivery. Traffic The traffic SLO example measures the amount of traffic or workload an application receives, either in terms of requests per second or data transfer rate.
For retail organizations, peak traffic can be a mixed blessing. While high-volume traffic often boosts sales, it can also compromise uptimes. Instead, to speed up response times, applications are now processing most data at the network’s perimeter, closest to the data’s origin.
To help you speed up MTTR, there are several levels of visualization to help slice and dice through information: Instances. The F5 BIG-IP LTM extension offers a complete view, beyond simple metrics, into your Local Traffic Manager (LTM) platform. And is that because of a spike in total requests? ”. Pool nodes. Virtual servers.
Today, the speed of software development has become a key business differentiator, but collaboration, continuous improvement, and automation are even more critical to providing unprecedented customer value. This capability provides version information along with an additional insight into traffic and problems per version.
For example, an organization might use security analytics tools to monitor user behavior and network traffic. Bolstered by powerful AI and intelligent automation, Dynatrace can help your organization stay secure, efficient, and scalable.
In doing so, they automate build processes to speed up delivery, and minimize human involvement to prevent error. One is the currently-running production environment receiving all user traffic (let’s say the “blue” one), the other is a clone of it (“green”), but idle. Response time for blue/green environment traffic.
Running A Page Speed Test: Monitoring vs. Measuring Running A Page Speed Test: Monitoring vs. Measuring Geoff Graham 2023-08-10T08:00:00+00:00 2023-08-10T12:35:05+00:00 This article is sponsored by DebugBear There is no shortage of ways to measure the speed of a webpage. Lighthouse results. One type is called lab data.
As teams try to gain insight into this data deluge, they have to balance the need for speed, data fidelity, and scale with capacity constraints and cost. In most cases, especially with more complex queries, Grail gives you answers at five to 100 times more speed than any other database you can use right now.”
I selfishly look at my blog posts (like this one) and see whether LinkedIn, or Twitter, drove more traffic! If we see an issue, or more importantly if Davis (The Dynatrace AI engine) picks up a reduction in traffic or an increase in errors, we are quickly able to pinpoint why and fix it. Using Davis, the AI Engine.
In our increasingly digital world, the speed of innovation is key to business success. As a result, e xisting application security approaches can’t keep up with this speed and vari ability of modern development processes. . Dynatrace news. Organizations are rushing towards cloud-native application stacks for agility.
This test helps to measure the speed, scalability, reliability, and stability of software under varying loads, thus it ensures stable performance. It checks the system’s responsiveness, speed, and stability under varying workload conditions. Today, let's learn more about this testing type in depth. What Is Performance Testing?
Resource consumption & traffic analysis. What is the network traffic going to be between services we migrate and those that have to stay in the current data center? How much traffic is sent between two processes hosting a certain service? Step 3: Detailed Traffic Dependency Analysis. What’s in your stack?”.
Edgar captures 100% of interesting traces , as opposed to sampling a small fixed percentage of traffic. Many approaches to distributed tracing involve setting a sample rate, such as 5%, and then only tracing that percentage of request traffic. In particular, they need to be able to count on Edgar having data about their issue.
A well-established metric we provide is APDEX , which tell us how users are perceiving page load times (time to the first byte, page speed, speed index), errors (JavaScript errors, crashes,) and also factors in the overall user journey (each user interaction) including their environment (browser, geolocation, bandwidth).
These include improving API traffic management and caching mechanisms to reduce server and network load, optimizing database queries, and adding additional compute resources, just to name some. Accelerate the Dynatrace Status portal update delivery speed and review our accessibility to Tech Support in such cases [In Progress].
With traffic growth, a single leader node handling all request volume started becoming overloaded. The path over which data travels from Titus Job Coordinator to a Titus Gateway cache can be described as a sequence of event queues with different processing speeds: A message generated by the event source may be buffered at any stage.
Allows them to speed up MTTR (Mean Time to Repair) in order to minimize user impact. As real user traffic started to pick up just after 8 am, it was clear that the fix also worked as expected for real user traffic. Delivers impact and root cause. A couple of manual test runs validated that the fix worked as expected.
We organize all of the trending information in your field so you don't have to. Join 5,000+ users and stay up to date on the latest articles your peers are reading.
You know about us, now we want to get to know you!
Let's personalize your content
Let's get even more personalized
We recognize your account from another site in our network, please click 'Send Email' below to continue with verifying your account and setting a password.


Let's personalize your content