This site uses cookies to improve your experience. To help us insure we adhere to various privacy regulations, please select your country/region of residence. If you do not select a country, we will assume you are from the United States. Select your Cookie Settings or view our Privacy Policy and Terms of Use.
Cookie Settings
Cookies and similar technologies are used on this website for proper function of the website, for tracking performance analytics and for marketing purposes. We and some of our third-party providers may use cookie data for various purposes. Please review the cookie settings below and choose your preference.
Used for the proper function of the website
Used for monitoring website traffic and interactions
Cookie Settings
Cookies and similar technologies are used on this website for proper function of the website, for tracking performance analytics and for marketing purposes. We and some of our third-party providers may use cookie data for various purposes. Please review the cookie settings below and choose your preference.
Strictly Necessary: Used for the proper function of the website
Performance/Analytics: Used for monitoring website traffic and interactions
What’s the problem with Black Friday traffic? If the mantra in sales is “Always be closing,” the mantra for online retail storefronts is “Always be online.”. Why Black Friday traffic threatens customer experience. Peak loads can overload and crash retailer websites and derail customer interactions. Dynatrace news.
Over the years, I have watched and written about online retail and e-commerce IT performance. What I have seen is a maturing of the online retail channels when it comes to delivering customer experiences. This year we saw few, if any, major issues with online retailers. This is where many retailers have matured over the years.
This is typically the first thing that comes to mind for IT professionals working in the retail industry when evaluating holiday readiness. CEOs of hybrid retailers prioritize e-commerce growth over in-store shopping, investing heavily in their online storefronts. That lesson remains important. Multi-channel logistics.
For retail, in particular, the crisis has forced many to accelerate the execution of strategic plans for digital customer experience and operational excellence. Consumers may be more likely to interact more “digitally” with brands going forward, and online sales are expected to make up a greater proportion of overall retail sales.
Over the last two month s, w e’ve monito red key sites and applications across industries that have been receiving surges in traffic , including government, health insurance, retail, banking, and media. The following day, a normally mundane Wednesday , traffic soared to 128,000 sessions.
While most government agencies and commercial enterprises have digital services in place, the current volume of usage — including traffic to critical employment, health and retail/eCommerce services — has reached levels that many organizations have never seen before or tested against. So how do you know what to prepare for?
Possible scenarios A Distributed Denial of Service (DDoS) attack overwhelms servers with traffic, making a website or service unavailable. Possible scenarios A retail website crashes during a major sale event due to a surge in traffic. These attacks can be orchestrated by hackers, cybercriminals, or even state actors.
Best Buy is designing its journey to cut through the noise of its multicloud and multi-tool environments to immediately pinpoint the root causes of issues during peak traffic loads. Previously, they had 12 tools with different traffic thresholds. federal agency. Customer Panel: Digital Transformation Watch now!
Think about retailers gearing up for Black Friday, sports betting companies preparing for specific games, or marketing teams orchestrating major campaigns. Even retail giants like Amazon have faced customer dissatisfaction during events like Prime Day when the website couldn't handle the traffic.
For retail organizations, peak traffic can be a mixed blessing. While high-volume traffic often boosts sales, it can also compromise uptimes. The nightmare scenario for online retailers during peak periods, such as Black Friday and Cyber Monday, is a system crash.
Some of these patterns can be planned for , such as peak seasons for travel and retail industries, while others are entirely spontaneous to the business. This can be increasingly difficult with spontaneous user habits – or other outside variables.
As e-commerce experiences become more sophisticated and we all rely on them more and more, observability for e-commerce applications and the clouds they run on has become more critical than ever to retailers’ success. You can see the traffic reaching each milestone of an online shopping journey.
Mobile retail e-commerce spending in the U. It detects regressions and deviations from previously observed behavior across metrics such as latency, traffic, error rates, saturation, security coverage, vulnerability risk levels, and memory consumption. surpassed $387 billion in 2022, more than double the figure of three years earlier.
Artificial intelligence and machine learning already have some impressive use cases for industries like retail, banking, or transportation. All these areas are receiving the same amount of coverage — although cities and towns need more internet traffic, and forests require very little.
STM generates traffic that replicates the typical path or behavior of a user on a network to measure performance for example, response times, availability, packet loss, latency, jitter, and other variables). Endpoint monitoring (EM).
AWS is enabling innovations in areas such as healthcare, automotive, life sciences, retail, media, energy, robotics that it is mind boggling and humbling. The City of Chicago is one of the first to bring sensors throughout the city that will permanently measure air quality, light intensity, sound volume, heat, precipitation, wind and traffic.
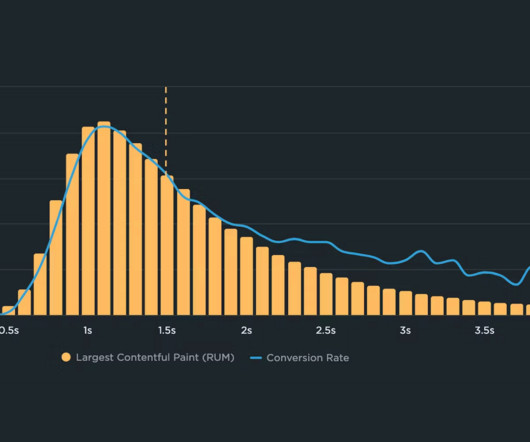
They give you a histogram view of all your user traffic, broken out into cohorts based on performance metrics, such as Start Render, Largest Contentful Paint, Interaction to Next Paint, and more. To improve conversions, you would need to move more traffic to the higher-converting side of the chart – as close to 1.1
Some of you may remember the Amazon outage of 2013, when the retail behemoth went down for 40 minutes. A correlation chart gives you a histogram view (represented in the yellow bars in the chart below) of all your user traffic, broken out into cohorts based on performance metrics (such as Start Render and Largest Contentful Paint).
From online retail to finance, and from streaming entertainment to healthcare providers and agencies, all manner of businesses and government entities have seen their web traffic and app activity explode. COVID-19 has changed everything for many organizations, and it did so overnight, with no time to prepare.
In support of Amazon Prime Day 2017, the biggest day in Amazon retail history, DynamoDB served over 12.9 VPC Endpoints give you the ability to control whether network traffic between your application and DynamoDB traverses the public Internet or stays within your virtual private cloud. million requests per second.
This was a lesson we had already learned from our experiences with Amazon retail, but it became even more important for AWS’s API-centric business. AWS has come to support many different workloads; from high-volume transaction processing to video transcoding at scale, from high-performance parallel computing to massive web site traffic.
Whether it is gaming, adtech, travel, or retail—speed wins, it's simple. As the use cases for Redis continue to grow, customers have demanded more flexibility in scaling their workloads dynamically, while continuing to be highly available and serving incoming traffic.
Background For this new investigation, I selected four sites that experience a significant amount of user traffic. Related: Web performance for retailers How to create correlation charts How to benchmark your site against your competitors How to set up real user monitoring (RUM)
Using cloud computing as the underlying technology to run the LBS platform Tom Tom is able to provide developers with on-demand content that will enable them to build location based applications for fleet management, route planning, traffic management or spatial analytics. .
By encapsulating tasks into separate services, parts of an application can be developed independently, deployed efficiently as containers, and scaled out automatically with new instances as traffic grows. For instance, the verbs on a retail site might include browsing, adding to a shopping cart, buying, and rating. The design stage.
Looking at the industry benchmarks for US retailers , four well-known sites have backend times that are approaching – or well beyond – that threshold. Pagespeed Benchmarks - US Retail - LCP When you examine a waterfall, it's pretty obvious that TTFB is the long pole in the tent, pushing out render times for the page.
Evaluate CDN performance by exploring the impact of time-of-day traffic patterns. Fixing high-traffic but poor-performing areas of your site will help lift your overall metrics. Optimize your funnel by understanding differences between users that convert or bounce from your site and users who don't. RUM update: Page labels.
The disruption is not simply the result of a ship running aground and blocking traffic in a busy, narrow passageway. This has caused considerable disruption to global supply chains. Some have incorrectly referred to the incident and the aftermath as a “black swan” event.
one of the world's largest online retailers, Amazon relies heavily on its website and digital infrastructure to facilitate sales and generate revenue. The stakes are even higher during high-traffic periods such as Black Friday or Cyber Monday. In 2013, Amazon experienced a brief outage that lasted approximately 30 minutes.
one of the world's largest online retailers, Amazon relies heavily on its website and digital infrastructure to facilitate sales and generate revenue. The stakes are even higher during high-traffic periods such as Black Friday or Cyber Monday. In 2013, Amazon experienced a brief outage that lasted approximately 30 minutes.
Labor's power in America arguably peaked in the 1960s and has been on the wane since, the striking Air Traffic Controllers getting fired in the early 80s often held out as a seminal moment in labor's multi-decade decline. But some of you may recall that in the late 1990s, labor briefly had a moment.
There are plenty of examples - music publishing, mass-market retailing, local transportation - where new entrants have left a wake of creative destruction in their path. The chattering classes are telling us that we live in an "ideas economy" a full half-century after it was ripe to traffic in ideas.
According to Statista , at least 50% of global online traffic is driven by mobile users. We were going through Adobe Retail Shopping Insights (2020) and found out that more than 42% of consumers have done their holiday shopping via smartphones.
For example, you can filter Core Web Vitals by region, or find regions with the most traffic. That's the most reliable way to ensure that you're creating meaningful performance goals for your pages. Geographic region We now record users' geographic region, also known as country subdivision.
Background For this new investigation, I selected four sites that experience a significant amount of user traffic. Related: Web performance for retailers How to create correlation charts How to benchmark your site against your competitors How to set up real user monitoring (RUM)
During the holiday season, an e-commerce platform anticipating a traffic surge could use preventive observability to predict slowdowns or overloads, proactively scale resources, optimize performance, and balance cloud costs. For example, a global retailer could leverage observability to track energy efficiency across its data centers.
How distributed is your traffic? We’ve heard great accounts of customers who assume their traffic is 100% regional, only to find they have an entire contingent of users in another country! Are you only interested in a specific type of traffic? Considerations for determining your sample size.
Is brick-and-mortar retail dead? The authors traffic in interesting data, but either lack the courage to draw any conclusion beyond Things Might Change But Nobody Knows (thanks for that, so helpful), or use the data selectively to present defenses for their preference of what the future will be. Are cities dead? Is cash dead?
A website today receives a large chunk of its traffic from evergreen browsers — most of which have good support for ES6+, new JavaScript standards, new web platform APIs and CSS attributes. Smart Bundling: How To Serve Legacy Code Only To Legacy Browsers. Shubham Kanodia. 2018-10-15T14:30:13+02:00. 2019-04-29T18:34:58+00:00.
While Core Web Vitals are typically a big focus for retailers because they have a direct impact on search rank, they are not the only indicators of a good user experience. In fact, for a lot of customers, iOS traffic – which Vitals can't track – is the most popular and has higher conversion rates. Track your CDN.
Interlude: What we see in our data iPhones are responsible for the majority of traffic for US-based sites, which means they're the primary source of revenue for many online retailers. The inability to measure performance consistently across browsers perpetuates this issue.
We organize all of the trending information in your field so you don't have to. Join 5,000+ users and stay up to date on the latest articles your peers are reading.
You know about us, now we want to get to know you!
Let's personalize your content
Let's get even more personalized
We recognize your account from another site in our network, please click 'Send Email' below to continue with verifying your account and setting a password.


Let's personalize your content