This site uses cookies to improve your experience. To help us insure we adhere to various privacy regulations, please select your country/region of residence. If you do not select a country, we will assume you are from the United States. Select your Cookie Settings or view our Privacy Policy and Terms of Use.
Cookie Settings
Cookies and similar technologies are used on this website for proper function of the website, for tracking performance analytics and for marketing purposes. We and some of our third-party providers may use cookie data for various purposes. Please review the cookie settings below and choose your preference.
Used for the proper function of the website
Used for monitoring website traffic and interactions
Cookie Settings
Cookies and similar technologies are used on this website for proper function of the website, for tracking performance analytics and for marketing purposes. We and some of our third-party providers may use cookie data for various purposes. Please review the cookie settings below and choose your preference.
Strictly Necessary: Used for the proper function of the website
Performance/Analytics: Used for monitoring website traffic and interactions
The Grail™ data lakehouse provides fast, auto-indexed, schema-on-read storage with massively parallel processing (MPP) to deliver immediate, contextualized answers from all data at scale. However, data overload and skills shortages present challenges that companies need to address to maximize the benefits of cloud and AI technologies.
Today, we’re excited to present the Distributed Counter Abstraction. In this context, they refer to a count very close to accurate, presented with minimal delays. After selecting a mode, users can interact with APIs without needing to worry about the underlying storage mechanisms and counting methods.
At this scale, we can gain a significant amount of performance and cost benefits by optimizing the storage layout (records, objects, partitions) as the data lands into our warehouse. We built AutoOptimize to efficiently and transparently optimize the data and metadata storage layout while maximizing their cost and performance benefits.
It filters out any invalid entries and enriches the valid ones with additional metadata, such as show or movie title details, and the specific page and row location where each impression was presented to users. This refined output is then structured using an Avro schema, establishing a definitive source of truth for Netflixs impression data.
They allow us to verify whether titles are presented as intended and investigate any discrepancies. However, taking this approach also presents several challenges: Catching Issues Ahead of Time: Logging primarily addresses post-launch scenarios, as logs are generated only after titles are shown to members.
This data is then aggregated in minute(s) intervals, calculating the number of impressions titles receive in near-real-time, and presented as an additional health status indicator for stakeholders. Specialized collectors access the Kafka queue every two minutes to retrieve impressions data.
Unlike full backups that duplicate everything, incremental backups store only changes since the last save, reducing storage needs and speeding up recovery. Key Benefits: Smaller Storage Footprint: Saves only modified data, cutting down backup size. New Query Functions: JSON_EXISTS checks whether a specific key or value is present.
A distributed storage system is foundational in today’s data-driven landscape, ensuring data spread over multiple servers is reliable, accessible, and manageable. Understanding distributed storage is imperative as data volumes and the need for robust storage solutions rise.
At first, data tiering was a tactic used by storage systems to reduce data storage costs. This involved grouping data that was not accessed as often into more affordable, if less effective, storage array choices. Even though they are quite costly, SSDs and flash can be categorized as high-performance storage classes.
Message brokers handle validation, routing, storage, and delivery, ensuring efficient and reliable communication. Message Broker vs. Distributed Event Streaming Platform RabbitMQ functions as a message broker, managing message confirmation, routing, storage, and delivery within a queue. What is RabbitMQ?
It must be said that this video traffic phenomenon primarily owes itself to modernizations in the scalability of streaming infrastructure, which simply weren’t present fifteen years ago.
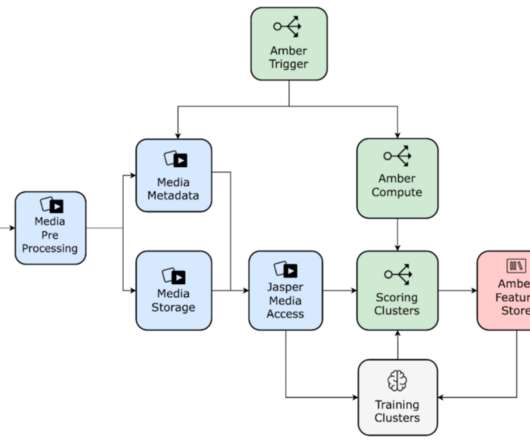
We will then present a case study of using these components in order to optimize, scale, and solidify an existing pipeline. Media Feature Storage: Amber Storage Media feature computation tends to be expensive and time-consuming. We accomplish this by paving the path to: Accessing and processing media data (e.g.
Note: If a particular key is always present in your document, it might make sense to store it as a first class column. JSONB storage has some drawbacks vs. traditional columns: PostreSQL does not store column statistics for JSONB columns. JSONB storage results in a larger storage footprint.
Observability data presents executives with new opportunities to achieve this, by creating incremental value for cloud modernization , improved business analytics , and enhanced customer experience. That’s because it does not require any pre-prepared schemas, and access to cold/hot storage is fully automatic and with zero latency.
Building an elastic query engine on disaggregated storage , Vuppalapati, NSDI’20. This paper presents Snowflake design and implementation along with a discussion on how recent changes in cloud infrastructure (emerging hardware, fine-grained billing, etc.) But the ephemeral storage service for intermediate data is not based on S3.
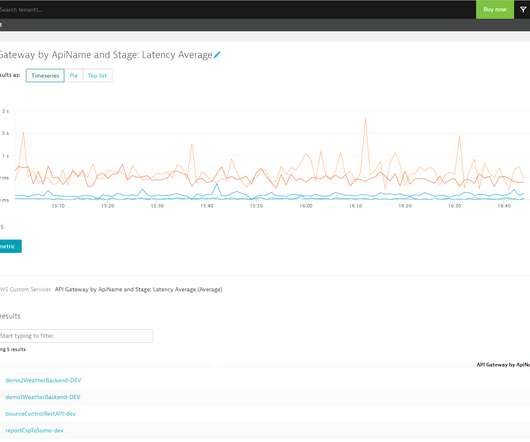
I wanted to present as much information as possible. Before we dive into the technical implementation, let me explain the visual concept of this “Global Status Page”: Another requirement for this status page was that it has to be lightweight, with no data storage at all. Real-time problem visualization of lots of environments.
Observability on edge devices presents unique challenges compared to traditional data-center or cloud-based environments. But there’s more than just a need for minimizing resource (CPU, memory, storage) and network (bandwidth) consumption for observability at the edge. Remote management and automated alerting are, therefore, crucial.
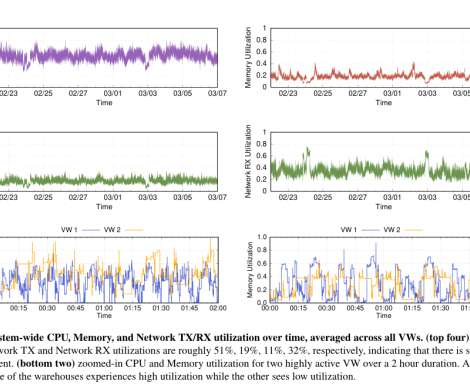
Secondly, determining the correct allocation of resources (CPU, memory, storage) to each virtual machine to ensure optimal performance without over-provisioning can be difficult. This presents a challenge for IT operations teams, specifically in identifying and addressing performance issues or planning how to prevent future issues.
At the same time, log analytics can present challenges as data volumes explode, particularly in traditional environments that lack end-to-end observability solutions. Cold storage and rehydration. Cold storage and rehydration. Data that organizations may need to access only once a quarter or year can reside in cold storage.
At the same time, log analytics can present challenges as data volumes explode, particularly in traditional environments that lack end-to-end observability solutions. Cold storage and rehydration. Cold storage and rehydration. Data that organizations may need to access only once a quarter or year can reside in cold storage.
While Atlas is architected around compute & storage separation, and we could theoretically just scale the query layer to meet the increased query demand, every query, regardless of its type, has a data component that needs to be pushed down to the storage layer.
These next-generation cloud monitoring tools present reports — including metrics, performance, and incident detection — visually via dashboards. Cloud storage monitoring. Teams can keep track of storage resources and processes that are provisioned to virtual machines, services, databases, and applications.
If a more granular rule is present on the host level, that rule will precede any blanket rule on, for example, the tenant level. This allows you to create flexible and powerful log storage configurations on any level by utilizing the unique autodiscovery capabilities of Dynatrace OneAgent or a custom setup. Host group.
But on their own, logs present just another data silo as IT professionals attempt to troubleshoot and remediate problems. In most data storage models, indexing engines enable faster access to query logs. But indexing requires schema management and additional storage to be effective, which adds cost and overhead.
Edgar helps Netflix teams troubleshoot distributed systems efficiently with the help of a summarized presentation of request tracing, logs, analysis, and metadata. Sample latency analysis Edgar should reduce burden, not add to it Presenting all of this data in one interface reduces the footwork of an engineer to uncover each source.
My Best Christmas Present â?? S3 is not only a highly reliable and available storage service but also one of the most powerful web serving engines that exists today. Root Domain Support for Amazon S3 Website Hosting. By Werner Vogels on 27 December 2012 12:00 PM. Comments ().
Dynatrace SaaS presents a lower total cost of ownership (TCO), enabling customers to consolidate various tools, thereby optimizing costs and enhancing internal user experiences. Moving customers from Managed to SaaS presents a valuable opportunity to grow customer accounts by delivering enhanced end-to-end value.
Every storage location involving data at rest is encrypted as well. The security controls presented above are audited on an annual basis by independent security assessors. No manual, error-prone steps are involved. Communication involving data in transit is encrypted using the latest industry standards (TLS 1.2).
Initially, Outlook users make PST (as an ellipsis for personal storage tables) files to save them from the slow presentation as well as data corruption. Outlook data files (PST) cover all the mailbox data and its features such as contacts, emails, calendars, etc. Here, we will learn the technique to merge PST files.
However, storing and querying such data presents a unique set of challenges: High Throughput : Managing up to 10 million writes per second while maintaining high availability. Storage Layer The storage layer for TimeSeries comprises a primary data store and an optional index data store. Note : With Cassandra 4.x
You’re then presented with the Dynatrace Managed cluster deployment page, which contains basic information about Dynatrace, the solution itself, and a link to our documentation. We’re currently adding individual mount points for different storage types and separate disk setup for each of these storage types.
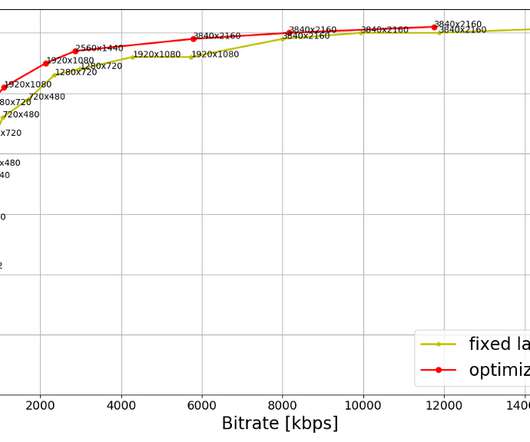
We present two sets. On the other hand, the optimized ladder presents a sharper increase in quality with increasing bitrate. In spite of reaching higher qualities than the fixed ladder, the HDR-DO ladder, on average, occupies only 58% of the storage space compared to fixed-bitrate ladder. The first set (Fig.
Data scale and silos present challenges to DevOps maturity DevOps teams often run into problems trying to drive better data-driven decisions with observability and security data. When data storage strategies become problematic to DevOps maturity Data warehouse-based approaches add cost and time to analytics projects.
For how our machine learning recommendation systems leverage our key-value stores, please see more details on this presentation. Then the KV DAL handles writing to the appropriate underlying storage engines depending on latency, availability, cost, and durability requirements.
While it is powerful, it presents several challenges that affect its adoption. With Dynatrace, teams can seamlessly monitor the entire system, including network switches, database storage, and third-party dependencies. Chaos engineering is a practice that extends beyond traditional failure testing by identifying unpredictable issues.
In this blog post, we present benefits of applying the above-mentioned optimizations to standard dynamic range (SDR) 10-bit and 4K streams (some titles are also HFR). For example, two 1080p points with identical VMAF score or four 4K points with identical VMAF score, resulting in wasted bits and increased storage footprint.
To free disk space, log files related to metric and configuration storage, in addition to Elasticsearch log files, are now automatically deleted after two months. The Cluster nodes overview page now displays Dynatrace version and transaction storage size details for each node. Cluster Management Console.
In the keynote by Christina Yakomin and Steve Prazenica from Vanguard, the presenters recounted their journey from a monolith with alert-based incident reporting and no positive health signals to an observable microservice architecture. Trace-based sampling can help you save storage costs.
Azure Data Lake Storage Gen1. The other perspective that’s presented on the Azure Automation dashboard is the state of your deployment runs. We’re happy to announce that now you can gain cloud monitoring excellence with Dynatrace for 15 additional Azure services, including: Azure Automation Account. Azure Logic Apps.
The immense growth of Kubernetes presents new security challenges in runtime and increased complexity in hardening CI/CD pipelines in development. Redis is an in-memory key-value store and cache that simplifies processing, storage, and interaction with data in Kubernetes environments.
AWS offers a broad set of global, cloud-based services including computing, storage, networking, Internet of Things (IoT), and many others. Amazon Simple Storage Service (S3). Metrics for each service instance are presented in detailed charts—see the example for ECS below. Dynatrace news. Amazon Simple Queue Service (SQS).
This new service enhances the user visibility of network details with direct delivery of Flow Logs for Transit Gateway to your desired endpoint via Amazon Simple Storage Service (S3) bucket or Amazon CloudWatch Logs. A feature that enables you to present log data in a filterable table that is easy to work with. Log Viewer. Log Events.
Among these, you can find essential elements of application and infrastructure stacks, from app gateways (like HAProxy), through app fabric (like RabbitMQ), to databases (like MongoDB) and storage systems (like NetApp, Consul, Memcached, and InfluxDB, just to name a few). Customizable dashboard. Specialized Unified Analysis page.
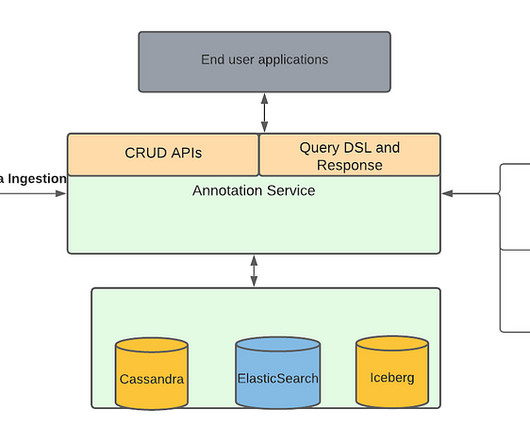
But we cannot search or present low latency retrievals from files Etc. The solution which we present in this blog is not limited to annotations and can be used for any other domain which uses ES and Cassandra as well. This is obviously very expensive. Write algo runs into files.
We organize all of the trending information in your field so you don't have to. Join 5,000+ users and stay up to date on the latest articles your peers are reading.
You know about us, now we want to get to know you!
Let's personalize your content
Let's get even more personalized
We recognize your account from another site in our network, please click 'Send Email' below to continue with verifying your account and setting a password.


Let's personalize your content