This site uses cookies to improve your experience. To help us insure we adhere to various privacy regulations, please select your country/region of residence. If you do not select a country, we will assume you are from the United States. Select your Cookie Settings or view our Privacy Policy and Terms of Use.
Cookie Settings
Cookies and similar technologies are used on this website for proper function of the website, for tracking performance analytics and for marketing purposes. We and some of our third-party providers may use cookie data for various purposes. Please review the cookie settings below and choose your preference.
Used for the proper function of the website
Used for monitoring website traffic and interactions
Cookie Settings
Cookies and similar technologies are used on this website for proper function of the website, for tracking performance analytics and for marketing purposes. We and some of our third-party providers may use cookie data for various purposes. Please review the cookie settings below and choose your preference.
Strictly Necessary: Used for the proper function of the website
Performance/Analytics: Used for monitoring website traffic and interactions
One key factor that significantly affects the performance of data processing is the storage format of the data. This article explores the impact of different storage formats, specifically Parquet, Avro, and ORC on query performance and costs in big data environments on Google Cloud Platform (GCP).
Because of the emergence of cloud services, a broad range of storage choices are now easily available to fulfill the different demands of both organizations and people. These storage alternatives have been designed to meet a range of requirements, including performance, scalability, durability, and price.
Site Reliability Engineers (SREs) also face significant challenges in maintaining database reliability, ensuring performance, and preventing disruptions in highly dynamic and distributed environments. Why this matters Databases are the backbone of modern applications, but they can also be a major source of performance bottlenecks.
Finding a storage solution for our ultra-heterogeneous computing cluster was challenging. We tried two solutions: object storage with s3fs + network-attached storage (NAS) and Alluxio + Fluid + object storage , but they had limitations and performance issues.
They offer significant performance benefits through batching writes and optimizing reads with sorted data structures. We’ll also dive deeper into SSTables , MemTables , and compaction strategies for optimizing performance in high-load environments.
This article analyzes the correlation between block sizes and their impact on storageperformance. This paper deals with definitions and understanding of structured data vs unstructured data, how various storage segments react to block size changes, and differences between I/O-driven and throughput-driven workloads.
At this scale, we can gain a significant amount of performance and cost benefits by optimizing the storage layout (records, objects, partitions) as the data lands into our warehouse. We built AutoOptimize to efficiently and transparently optimize the data and metadata storage layout while maximizing their cost and performance benefits.
OpenTelemetry is enhancing GenAI observability : By defining semantic conventions for GenAI and implementing Python-based instrumentation for OpenAI, OpenTel is moving towards addressing GenAI monitoring and performance tuning needs. The Collector is expected to be ready for prime time in 2025, reaching the v1.0
However, lurking beneath the surface lies a complex web of data storage and retrieval. That's why knowing how to debug mobile app database problems and optimize data storageperformance is essential for developers seeking excellence. When database problems arise, they can disrupt even the most well-crafted applications.
Using existing storage resources optimally is key to being able to capture the right data over time. This decompression of data is achieved with minimal impact on performance and costs. Increased storage space availability. Storage quotas defined for your Dynatrace Managed deployment and its environments.
This counting service, built on top of the TimeSeries Abstraction, enables distributed counting at scale while maintaining similar low latency performance. After selecting a mode, users can interact with APIs without needing to worry about the underlying storage mechanisms and counting methods.
As a developer, engineer, or architect, finding the right storage solution that seamlessly integrates with your infrastructure while providing the necessary scalability, security, and performance can be a daunting task. Whether you're a small startup or a large enterprise, StoneFly's storage solutions can grow with your business.
At first, data tiering was a tactic used by storage systems to reduce data storage costs. This involved grouping data that was not accessed as often into more affordable, if less effective, storage array choices. Even though they are quite costly, SSDs and flash can be categorized as high-performancestorage classes.
The Grail™ data lakehouse provides fast, auto-indexed, schema-on-read storage with massively parallel processing (MPP) to deliver immediate, contextualized answers from all data at scale. By prioritizing observability, organizations can ensure the availability, performance, and security of business-critical applications.
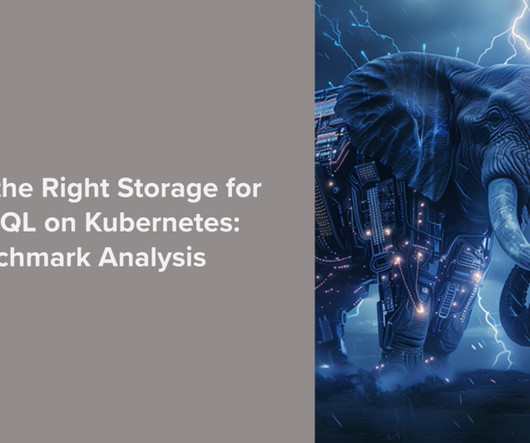
As more organizations move their PostgreSQL databases onto Kubernetes, a common question arises: Which storage solution best handles its demands? Picking the right option is critical, directly impacting performance, reliability, and scalability.
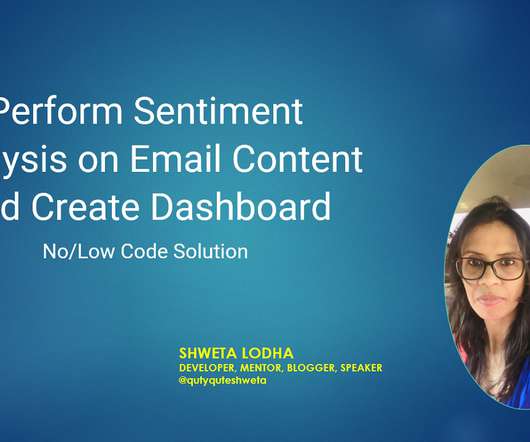
This video talks about an end-to-end flow, wherein an email content having a specific subject line will be read, the email body would be analyzed using Azure Cognitive Services (Sentiment analysis), analysis results would be saved in Azure Table Storage and finally, the chart would be drawn in Excel.
Secondly, determining the correct allocation of resources (CPU, memory, storage) to each virtual machine to ensure optimal performance without over-provisioning can be difficult. This presents a challenge for IT operations teams, specifically in identifying and addressing performance issues or planning how to prevent future issues.
This article outlines the key differences in architecture, performance, and use cases to help determine the best fit for your workload. Message brokers handle validation, routing, storage, and delivery, ensuring efficient and reliable communication. What is RabbitMQ?
RabbitMQ is a powerful and widely used message broker that facilitates communication between distributed applications by handling the transmission, storage, and delivery of messages.
Dynatrace OTel Collector Understand your applications with ease Due to a lack of contextual insights and actionable intelligence, application teams often find themselves overwhelmed by data, unable to quickly identify the root causes of performance issues. There is no need to think about schema and indexes, re-hydration, or hot/cold storage.
In this post, we are going to compare the performance and pricing of DigitalOcean PostgreSQL vs. ScaleGrid PostgreSQL to help you determine the best PostgreSQL hosting service on DigitalOcean. On average, ScaleGrid provides over 30% more storage vs. DigitalOcean for PostgreSQL at the same affordable price. Compare Pricing. Single Node.
These are just some of the topics being showcased at Perform 2023 in Las Vegas. Perform 2023 news At Perform 2023 in Las Vegas, the headliner theme is IT automation. What’s more, organizations are no longer concerned only about application performance and sales numbers. We’ll post news here as it happens!
Caching is the process of storing frequently accessed data or resources in a temporary storage location, such as memory or disk, to improve retrieval speed and reduce the need for repetitive processing.
Greenplum uses an MPP database design that can help you develop a scalable, high performance deployment. High performance, query optimization, open source and polymorphic data storage are the major Greenplum advantages. The Greenplum Architecture. Greenplum Advantages. Major Use Cases. Query Optimization. over Greenplum 5.
In the previous posts, we covered things we had to do to upload files on the front end, things we had to do on the back end, and optimizing costs by moving file uploads to object storage.
MongoDB offers several storage engines that cater to various use cases. The default storage engine in earlier versions was MMAPv1, which utilized memory-mapped files and document-level locking. This allowed for sequential access and indexed access, but random writes could cause performance issues.
ScaleGrid provides 30% more storage on average vs. DigitalOcean for MySQL at the same affordable price. MySQL DigitalOcean Performance Benchmark. We are going to use a common, popular plan size using the below configurations for this performance benchmark: Comparison Overview. Compare Pricing. DigitalOcean. Instance Type.
Track business metrics, key performance indicators (KPIs), and service level objectives (SLOs) — automatically and in context with IT infrastructure and services — to promote collaboration between business and IT teams. Reduced storage and query overhead for business use cases. Improved data management.
A distributed storage system is foundational in today’s data-driven landscape, ensuring data spread over multiple servers is reliable, accessible, and manageable. Understanding distributed storage is imperative as data volumes and the need for robust storage solutions rise.
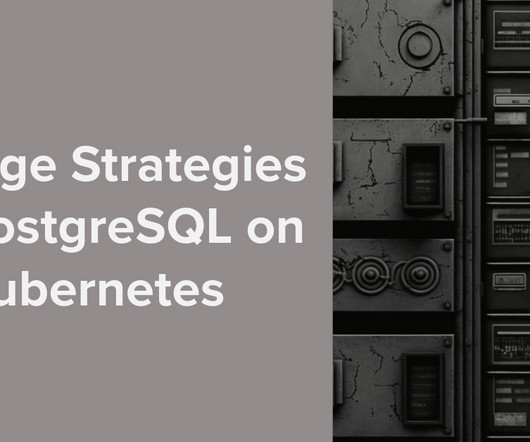
There are a wealth of options on how you can approach storage configuration in Percona Operator for PostgreSQL , and in this blog post, we review various storage strategies — from basics to more sophisticated use cases. For example, you can choose the public cloud storage type – gp3, io2, etc, or set file system.
Mobile applications (apps) are an increasingly important channel for reaching customers, but the distributed nature of mobile app platforms and delivery networks can cause performance problems that leave users frustrated, or worse, turning to competitors. What is mobile app performance? Issue remediation.
The enriched data is seamlessly accessible for both real-time applications via Kafka and historical analysis through storage in an Apache Iceberg table. Automating Performance Tuning with Autoscalers Tuning the performance of our Apache Flink jobs is currently a manual process.
Microsoft Azure SQL is a robust, fully managed database platform designed for high-performance querying, relational data storage, and analytics. For a typical web application with a backend, it is a good choice when we want to consider a managed database that can scale both vertically and horizontally.
For cloud operations teams, network performance monitoring is central in ensuring application and infrastructure performance. Network performance monitoring core to observability For these reasons, network activity becomes a key data source in IT observability. Teams also don’t have to maintain normalized schemas to query data.
In the recently published Gartner® “ Critic al Capabilities for Application Performance Monitoring and Observability,” Dynatrace scored highest for the IT Operations Use Case (4.15/5) This is accomplished by using service monitoring and anomaly detection for early-warning notifications of performance issues.” 5) in the Gartner report.
The load testing for the database needs to be conducted usually so that the impact on the system can be monitored in different scenarios, such as query language rule optimization, storage engine parameter adjustment, etc. The operating system in this article is the x86 CentOS 7.8.
This extends Dynatrace visibility into Citrix user experience and Citrix platform performance. Therefore, it requires multidimensional and multidisciplinary monitoring: Infrastructure health —automatically monitor the compute, storage, and network resources available to the Citrix system to ensure a stable platform. Citrix VDA.
With the rise of microservices and cloud-native applications, Jaeger has become a crucial tool for developers and system administrators to gain insights into the performance and behavior of their applications. Use the best-performing Jaeger storage backend that you can find.
from a client it performs two parallel operations: i) persisting the action in the data store ii) publish the action in a streaming data store for a pub-sub model. User Feed Service, Media Counter Service) read the actions from the streaming data store and performs their specific tasks. After that, the various services (e.g.
Firstly, developers struggled to reason about consistency, durability and performance in this complex global deployment across multiple stores. This flexibility allows our Data Platform to route different use cases to the most suitable storage system based on performance, durability, and consistency needs.
High-performance computing systems often use all-flash architectures and kernel-mode parallel file systems to satisfy performance demands. However, the increasing sizes of both data volumes and distributed system clusters raise significant cost challenges for all-flash storage and vast operational challenges for kernel clients.
For the longest time, hosting static files on CDNs was the de facto standard for performance tuning website pages. The host offered browser caching advantages, better stability, and storage on fast edge servers across strategic geolocations. Not only did it have performance benefits, but it was also convenient for developers.
We organize all of the trending information in your field so you don't have to. Join 5,000+ users and stay up to date on the latest articles your peers are reading.
You know about us, now we want to get to know you!
Let's personalize your content
Let's get even more personalized
We recognize your account from another site in our network, please click 'Send Email' below to continue with verifying your account and setting a password.


Let's personalize your content