This site uses cookies to improve your experience. To help us insure we adhere to various privacy regulations, please select your country/region of residence. If you do not select a country, we will assume you are from the United States. Select your Cookie Settings or view our Privacy Policy and Terms of Use.
Cookie Settings
Cookies and similar technologies are used on this website for proper function of the website, for tracking performance analytics and for marketing purposes. We and some of our third-party providers may use cookie data for various purposes. Please review the cookie settings below and choose your preference.
Used for the proper function of the website
Used for monitoring website traffic and interactions
Cookie Settings
Cookies and similar technologies are used on this website for proper function of the website, for tracking performance analytics and for marketing purposes. We and some of our third-party providers may use cookie data for various purposes. Please review the cookie settings below and choose your preference.
Strictly Necessary: Used for the proper function of the website
Performance/Analytics: Used for monitoring website traffic and interactions
An open-source database is your best bet for many reasons. As organizations are looking for more and more open-source products to run their enterprise business, this gives them greater flexibility and cost-effectiveness. Achieving lower costs while maintaining high-performance databases is critical.
In this blog, I'll describe a couple of new performance features that you'll find in Postgres 17 as well as another important logical replication feature that I didn't cover in my earlier blog of this series. After a successful 3rd beta in August 2024, the PostgreSQL development group released the GA version on September 26th.
This is an article from DZone's 2022 Performance and Site Reliability Trend Report. Open-source software (OSS) has had a profound impact on modern application delivery. For more: Read the Report.
Ready to transition from a commercial database to opensource, and want to know which databases are most popular in 2019? We broke down the data by opensource databases vs. commercial databases: OpenSource Databases. Popular examples of opensource databases include MySQL, PostgreSQL and MongoDB.
Andreas Grabner, DevOps Activist at Dynatrace, took to the virtual stage at the recent Dynatrace Perform conference to describe how the opensource Keptn project automates the configuration of observability tools, dashboards, and alerting based on service-level objectives (SLOs). SLO-based release validation made easy.
Open-Sourcing a Monitoring GUI for Metaflow, Netflix’s ML Platform tl;dr Today, we are open-sourcing a long-awaited GUI for Metaflow. link] Metaflow is a full-stack framework for data science that we started developing at Netflix over four years ago and which we open-sourced in 2019.
As a solution, teams often adopt opensource observability tools like OpenTelemetry to gain situational awareness of their cloud-native environments. In a session at Dynatrace Perform 2022, Kopp joins Tim Gerlach, Product Owner of APM at SAP Business Platform to describe how. However, adding more tools can add yet another silo.
As an open-source project, OpenTelemetry sets standards for telemetry data sets and works with a wide range of systems and platforms to collect and export telemetry data to backend systems. Profiling Profiling has always been a crucial aspect of performance monitoring, and its great to see OpenTelemetry catching up.
These are just a few of the open-source technologies you may encounter as you research observability solutions for managing complex multicloud IT environments and the services that run on them. Of these open-source observability tools, one stands out. Source: OpenTelemetry Documentation. Dynatrace news.
Syslog is the go-to protocol that delivers infrastructure administrators, network engineers, and security team logs that tell them all they need to know about their systems’ delivery, performance, availability, and security. We also provide security updates and patches to critical vulnerabilities that may arise in the components.
Image Source. Why Is Kubernetes Performance Tuning Needed? As Kubernetes becomes a basic infrastructure for many organizations, performance tuning for Kubernetes clusters is becoming more important. Kubernetes is a highly scalable open-source platform for orchestrating containerized workloads in server environments.
Developers not only write code; they’re also accountable for their applications performance and reliability. Debug data from third-party and opensource, too! Debugging third-party and opensource code, and even external libraries for which you dont have the source code, can be an extremely complex task.
As performance engineers, it is our responsibility to learn various tools and technologies. Let us see HTTP Toolkit for Performance Engineers. It is an open-source tool to debug, test, intercept HTTP(S) requests. In this blog post, we are going to deep-dive into the HTTP Toolkit and its features. What is HTTP Toolkit?
There are umpteen performance testing tools available in the commercial market as well as in the open-source repositories. Recently, Go-based performance testing tools are exploding in the open-source world. Based on our requirements, we can choose the best tool from the arsenal.
Advanced Features: Does the tool support stored procedures, triggers, indexing, and performance analysis? Licensing, Security, and Support Free vs. Paid: Is the tool free, open-source, or does it require a license or subscription? Cons: Slow performance when handling large datasets or complex queries.
Observability has become a key component in software development as it enables the best customer experience by ensuring system health and performance and detecting systemic issues proactively. OpenSearch simplifies this by providing an open-source, scalable solution for logging, metrics, and visualization.
Kubernetes is a widely used opensource system for container orchestration. Service-level objectives (SLOs) can play a vital role in ensuring that all stakeholders have visibility into the resources being used and the performance of their applications.
Greenplum Database is an open-source , hardware-agnostic MPP database for analytics, based on PostgreSQL and developed by Pivotal who was later acquired by VMware. Greenplum uses an MPP database design that can help you develop a scalable, high performance deployment. OpenSource. What Exactly is Greenplum?
Built and maintained by Oracle, it provides an all-in-one solution for database modeling, query execution, user administration, and performance monitoring. Most of these options offer free trials or open-source licensesso try a few and see what fits your workflow best. <p>The </p>
For software engineering teams, this demand means not only delivering new features faster but ensuring quality, performance, and scalability too. One way to apply improvements is transforming the way application performance engineering and testing is done. Performance-as-a-self-service . Try it today using Keptn .
One such open-source, distributed search and analytics engine is Elasticsearch, which is very efficient at handling data in large sets and high-velocity queries. However, the process for effectively scaling Elasticsearch can be nuanced, since one needs a proper understanding of the architecture behind it and of performance tradeoffs.
MySQL is the number one opensource database that’s commonly hosted through Azure instances. While Microsoft offers their own Azure Database product, there are other alternatives available that may be able to help you improve your MySQL performance. MySQL Azure Performance Benchmark. MySQL Read-Intensive Performance.
OpenTelemetry Astronomy Shop is a demo application created by the OpenTelemetry community to showcase the features and capabilities of the popular open-source OpenTelemetry observability standard. In the main view, you can compare the performance and health of each service and detect possible issues.
I work at Appsmith , an open-source low code platform for developers to build internal tools and workflows. Underneath the hood, the platform will evaluate all this code in an optimized manner to make sure the app remains performant yet responsive. They can use this while creating SQL queries, APIs, or triggering actions.
BlackDuck performs a security and vulnerability check, returning a scan result. This is why we’re aligned with opensource initiatives and compatible with the CI/CD specification in OpenTelemetry driven by the CDNF. Build : GitHub builds the code changes and creates a deployable image.
These are just some of the topics being showcased at Perform 2023 in Las Vegas. Perform 2023 news At Perform 2023 in Las Vegas, the headliner theme is IT automation. What’s more, organizations are no longer concerned only about application performance and sales numbers. We’ll post news here as it happens!
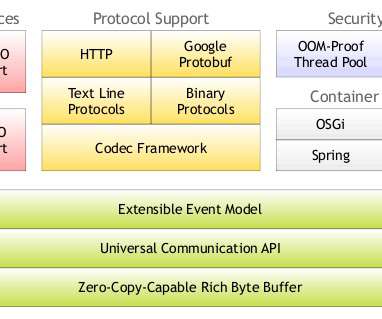
For years, researchers at UT Darmstadt have compared the performance of message-oriented middleware servers based on Java Messaging Service (JMS). In 2010, the SPECjms2007 benchmark record was smashed by HornetQ , an open-source enterprise messaging system from JBoss.
In these modern environments, every hardware, software, and cloud infrastructure component and every container, open-source tool, and microservice generates records of every activity. In a monitoring scenario, you typically preconfigure dashboards that are meant to alert you to performance issues you expect to see later.
The study analyzes factual Kubernetes production data from thousands of organizations worldwide that are using the Dynatrace Software Intelligence Platform to keep their Kubernetes clusters secure, healthy, and high performing. Open-source software drives a vibrant Kubernetes ecosystem. Java, Go, and Node.js
Selenium is an open-source automation framework initially introduced in 2004. Testing performed using Selenium are generally referred to as Selenium testing. Using this framework, we can validate web applications across different browsers and platforms. Java, C#, Python are mostly used for developing test scripts.
This is an article from DZone's 2021 Application Performance Management Trend Report. Performance in any cloud-distributed application is key to successful user experience. Thus, having a deep understanding of how to measure performance and what metric IO pattern to use is quite important. For more: Read the Report.
It reports batch sizes and HTTP/RPC measurements of its own pipelines as histograms, providing valuable metrics for performance monitoring. By exporting metrics from different sources into a single platform, teams can achieve a holistic view of their system’s performance, facilitating proactive issue resolution and faster decision-making.
Docker Engine is built on top containerd , the leading open-source container runtime, a project of the Cloud Native Computing Foundation (DNCF). Kubernetes is an open-source container orchestration platform for managing, automating, and scaling containerized applications. Here the overlap with Kubernetes begins.
This powerful tool can be leveraged across various environments, including production, to enhance development processes and ensure robust application performance. Performance benchmarking Performance benchmarking is one of the unresolved mysteries of software engineering. In many ways, it’s more of an art than a science.
Optimize database performance. Small changes in a database can have an enormous impact on overall application performance. One simple but effective way of checking high-performance databases is by analyzing the slow query log. One simple but effective way of checking high-performance databases is by analyzing the slow query log.
In today's fast-paced software world, keeping track of how applications are performing is very important. OpenTelemetry is a free, open-source framework that helps collect and send out data on how your applications are running. Two major tools that help with this are OpenTelemetry and Dynatrace.
In this blog, I will be going through a step-by-step guide on how to automate SRE-driven performance engineering. You may have seen over the past few months we have been extensively promoting Service Level Indicators (SLIs) and Service Level Objectives (SLOs) as part of our OpenSource project Keptn.
In this article, I’m going to demonstrate how you can migrate a comprehensive web application from MySQL to YugabyteDB using the open-source data migration engine YugabyteDB Voyager. This helps improve availability, scalability, and performance.
By Jose Fernandez Today, we are thrilled to announce the release of bpftop , a command-line tool designed to streamline the performance optimization and monitoring of eBPF applications. This tool minimizes overhead by enabling performance statistics only while it is active.
At our virtual conference, Dynatrace Perform 2022 , the theme is “Empowering the game changers.”. Empowering the game changers at Dynatrace Perform 2022. While conventional monitoring scans the environment using correlation and statistics, it provides little contextual information for remediating performance or security issues.
Traditional debugging approaches, logs, and occasional remote breakpoint instrumentation cant easily keep pace with cloud-native AI deployments, where performance, compliance, and costs are all on the line. How can you gain insights that drive innovation and reliability in AI initiatives without breaking the bank?
The unstoppable rise of opensource databases. One database in particular is causing a huge dent in Oracle’s market share – opensource PostgreSQL. See how opensource PostgreSQL Community version costs compare to Oracle Standard Edition and Oracle Enterprise Edition. What’s causing this massive shift?
Gaining visibility to manage the performance and security of serverless applications in distributed public clouds can be difficult. At Perform 2022, Dynatrace will showcase how its observability platform extends AI-powered insights to serverless architecture spanning multiple cloud environments.
I recently joined two industry veterans and Dynatrace partners, Syed Husain of Orasi and Paul Bruce of Neotys as panelists to discuss how performance engineering and test strategies have evolved as it pertains to customer experience. What do you see as the biggest challenge for performance and reliability? Dynatrace news.
We organize all of the trending information in your field so you don't have to. Join 5,000+ users and stay up to date on the latest articles your peers are reading.
You know about us, now we want to get to know you!
Let's personalize your content
Let's get even more personalized
We recognize your account from another site in our network, please click 'Send Email' below to continue with verifying your account and setting a password.


Let's personalize your content