This site uses cookies to improve your experience. To help us insure we adhere to various privacy regulations, please select your country/region of residence. If you do not select a country, we will assume you are from the United States. Select your Cookie Settings or view our Privacy Policy and Terms of Use.
Cookie Settings
Cookies and similar technologies are used on this website for proper function of the website, for tracking performance analytics and for marketing purposes. We and some of our third-party providers may use cookie data for various purposes. Please review the cookie settings below and choose your preference.
Used for the proper function of the website
Used for monitoring website traffic and interactions
Cookie Settings
Cookies and similar technologies are used on this website for proper function of the website, for tracking performance analytics and for marketing purposes. We and some of our third-party providers may use cookie data for various purposes. Please review the cookie settings below and choose your preference.
Strictly Necessary: Used for the proper function of the website
Performance/Analytics: Used for monitoring website traffic and interactions
Networkvirtualization has been one of the most significant advancements in the field of networking in recent years. It is a technique that allows the creation of multiple virtualnetworks, each with its own set of policies, services, and security mechanisms, on top of a single physical network infrastructure.
By Alok Tiagi , Hariharan Ananthakrishnan , Ivan Porto Carrero and Keerti Lakshminarayan Netflix has developed a network observability sidecar called Flow Exporter that uses eBPF tracepoints to capture TCP flows at near real time. Without having network visibility, it’s difficult to improve our reliability, security and capacity posture.
The convergence of software and networkingtechnologies has cleared the way for ground-breaking advancements in the field of modern networking. One such breakthrough is Software-Defined Networking (SDN), a game-changing method of network administration that adds flexibility, efficiency, and scalability.
The 21st century has given rise to a wealth of advancements in computer technology. Among these are virtual tools and programs that have applications in almost every industry imaginable. One area that virtualizationtechnology is making a huge impact is the security sector. How Is VirtualizationTechnology Used?
Quick and easy network infrastructure monitoring. Begin network monitoring by simply deploying an extension with just a few clicks. The topology model for network devices covers simple to complex use cases from visualizing the interfaces of a router to mapping an F5 Big-IP LTM load balancer. Virtual servers. Pool nodes.
Network traffic power calculations rely on static power estimations for both public and private networks. Static assumptions are: Local network traffic uses 0.12 Public network traffic uses 1.0 These estimates are converted using the emission factor for the data center location.
Virtualization has become a crucial element for companies and individuals looking to optimize their computing resources in today’s rapidly changing technological landscape. Mini PCs have become effective virtualization tools in this setting, providing a portable yet effective solution for a variety of applications.
More organizations are adopting a hybrid IT environment, with data center and virtualized components. Therefore, they need an environment that offers scalable computing, storage, and networking. Instead of treating storage, server, compute, and network functions as separate entities, HCI virtualizes these resources.
Additional benefits of Dynatrace SaaS on Azure include: No infrastructure investment : Dynatrace manages the infrastructure for you, including automatic visibility, problem detection, and smart alerting across virtualnetworks, virtual infrastructure, and container orchestration.
As more organizations adopt cloud-native technologies, traditional approaches to IT operations have been evolving. This transition to public, private, and hybrid cloud is driving organizations to automate and virtualize IT operations to lower costs and optimize cloud processes and systems. So, what is ITOps?
Dynatrace provides server metrics monitoring in under five minutes, showing servers’ CPU, memory, and network health metrics all the way through to the process level, with no manual configuration necessary. Auto-detection starts monitoring new virtual machines as they are deployed. How does Dynatrace help?
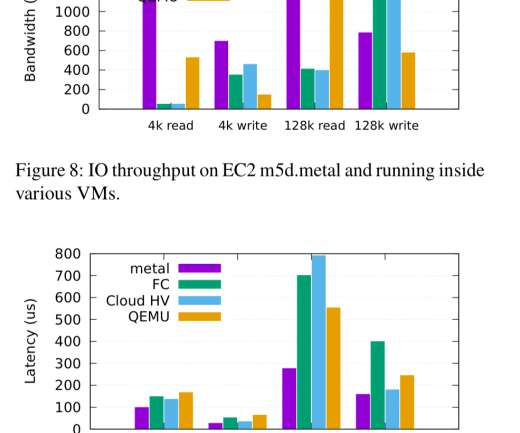
Hardware virtualization for cloud computing has come a long way, improving performance using technologies such as VT-x, SR-IOV, VT-d, NVMe, and APICv. At Netflix, we've been using these technologies as they've been made available for instance types in the AWS EC2 cloud. Each dimension has progressed through these stages: 1.
Therefore, it requires multidimensional and multidisciplinary monitoring: Infrastructure health —automatically monitor the compute, storage, and network resources available to the Citrix system to ensure a stable platform. Tie latency issues to host and virtualization infrastructure network quality.
Often, organizations resort to using separate tools for different parts of their technology stack. Performance monitoring Dynatrace can collect performance metrics from Nutanix clusters, including latency, IOPS (Input/Output Operations Per Second), and network throughput.
As cloud-native, distributed architectures proliferate, the need for DevOps technologies and DevOps platform engineers has increased as well. It coincides with the advent of complex, distributed cloud technologies such as microservices and containers. DevOps engineer tools can help ease the pressure as environment complexity grows.
Native support for Syslog messages Syslog messages are generated by default in Linux and Unix operating systems, security devices, network devices, and applications such as web servers and databases. Native support for syslog messages extends our infrastructure log support to all Linux/Unix systems and network devices.
Between multicloud environments, container-based architecture, and on-premises infrastructure running everything from the latest open-source technologies to legacy software, achieving situational awareness of your IT environment is getting harder to achieve. Getting adequate insight into an increasingly complex and dynamic landscape.
Digital experience monitoring is the practice of using tools and technologies to gather and evaluate metrics as a customer navigates an application to determine the quality of a user’s interaction with its digital touchpoints. PC, smartphone, server) or virtual (virtual machines, cloud gateways).
Dynatrace VMware and virtualization documentation . Dynatrace provides two technologies for Digital Experience Monitoring (DEM): Synthetic Monitoring and Real User Monitoring (RUM). When using autoscaling-mechanisms and having a lot of application containers, tracing requests through the network is a challenging task.
By Xiaomei Liu , Rosanna Lee , Cyril Concolato Introduction Behind the scenes of the beloved Netflix streaming service and content, there are many technology innovations in media processing. Our previous tech blog Packaging award-winning shows with award-winning technology detailed our packaging technology deployed on the streaming side.
To simulate those users’ journeys, multiple synthetic locations deployed within various sections of internal networks are required. A prominent solution is virtual machines, however, this is inadequate for customers who deploy their systems with Kubernetes. For large enterprises, this is not even a consideration. How does it work?
In support of these efforts, Dynatracers Sara Al-Hayale and Molly Rossman set out to establish a virtual internal women’s network to create connections and collectively identify ways to support and encourage female professional growth both at Dynatrace and the broader tech industry.
As an Amazon Web Services (AWS) Advanced Technology Partner, Dynatrace easily integrates with AWS to help you stay on top of the dynamics of your enterprise cloud environment?. It differentiates Dynatrace as an AWS Partner Network (APN) member with a fully tested product on AWS Outposts. “We Dynatrace news.
These releases often assumed ideal conditions such as zero latency, infinite bandwidth, and no network loss, as highlighted in Peter Deutsch’s eight fallacies of distributed systems. With Dynatrace, teams can seamlessly monitor the entire system, including network switches, database storage, and third-party dependencies.
CaaS automates the processes of hosting, deploying, and managing container technologies. Instead, enterprises manage individual containers on virtual machines (VMs). IaaS provides direct access to compute resources such as servers, storage, and networks. Managed orchestration. CaaS vs. IaaS. CaaS vs. FaaS.
These resources generate vast amounts of data in various locations, including containers, which can be virtual and ephemeral, thus more difficult to monitor. AWS provides a suite of technologies and serverless tools for running modern applications in the cloud. Serverless technologies can reduce management complexity.
Container technology enables organizations to efficiently develop cloud-native applications or to modernize legacy applications to take advantage of cloud services. But managing the deployment, modification, networking, and scaling of multiple containers can quickly outstrip the capabilities of development and operations teams.
Firecracker is the virtual machine monitor (VMM) that powers AWS Lambda and AWS Fargate, and has been used in production at AWS since 2018. The traditional view is that there is a choice between virtualization with strong security and high overhead, and container technologies with weaker security and minimal overhead.
As organizations adopt microservices architecture with cloud-native technologies such as Microsoft Azure , many quickly notice an increase in operational complexity. Getting precise root cause analysis when dealing with several layers of virtualization in a containerized world. Dynatrace news. Operational excellence. Reliability.
In addition to providing visibility for core Azure services like virtual machines, load balancers, databases, and application services, we’re happy to announce support for the following 10 new Azure services, with many more to come soon: Virtual Machines (classic ones). Azure VirtualNetwork Gateways. Azure Batch.
VPC Flow Logs is an Amazon service that enables IT pros to capture information about the IP traffic that traverses network interfaces in a virtual private cloud, or VPC. By default, each record captures a network internet protocol (IP), a destination, and the source of the traffic flow that occurs within your environment.
With Dynatrace Infrastructure Monitoring you get a complete solution for the monitoring of cloud platforms and virtual infrastructure, along with log monitoring and AIOps. Infrastructure monitoring includes automatic visibility, problem detection, and smart alerting across virtualnetworks, virtual infrastructure, and container orchestration.
Amazon Web Services (AWS) Outpost : This offering provides pre-configured hardware and software for customers to run native AWS computing, networking, and services on-premises in a cloud-native manner. This orchestration layer uses software-based tools to automate IT tasks and manage resources—virtualized or other.
The combined ability of Dynatrace and our partners to address this growing TAM with efficient, high-speed land and expand deals is underpinned by the 530+ cloud services and technology integrations available on the Dynatrace Hub. Service Provider of the Year: DXC Technology. Partner Program update – new Ignite tier.
The combined ability of Dynatrace and our partners to address this growing TAM with efficient, high-speed land and expand deals is underpinned by the 530+ cloud services and technology integrations available on the Dynatrace Hub. Service Provider of the Year: DXC Technology. Partner Program update – new Ignite tier.
It covers these key areas: Technology & Dependency Analysis. Step 1: Get to Know your Technology & Service Stack. Before starting any migration project, you must have a good overview of all your hosts, processes, services and technologies. Which technologies are candidates to be moved? What’s in your stack?”.
How IT operations teams can de-silo monitoring data According to the Gartner report, “IT operations practitioners may be in specific silos, such as the network team, server team, virtualization team, application support team or other cross-functional teams (such as a generalized monitoring team). and/or its affiliates in the U.S.
Last week we held our first two Amplify events of the year – our virtual sales kickoff across NORAM, LATAM, and EMEA. Innovation is at the heart of success, and no one knows that more than our winner of the LATAM Cloud Innovation Award – Netjer Networks. Dynatrace news. Cloud Innovation Award, LATAM. Congratulations to all the team.
Most enterprises use serverless functions as part of a broader hybrid environment, covering both cloud and traditional technologies. Dynatrace provides AWS Lambda metrics monitoring in less than five minutes, showing the function CPU, memory, and network health metrics all the way through to the process level. What is Lambda SnapStart?
The process involves monitoring various components of the software delivery pipeline, including applications, infrastructure, networks, and databases. Infrastructure monitoring Infrastructure monitoring reviews servers, storage, network connections, virtual machines, and other data center elements that support applications.
What Dynatrace deployment is the best fit for your technology stack, and is the OneAgent compatible with your system? Virtualization can be a key player in your process’ performance, and Dynatrace has built-in integrations to bring metrics about the Cloud Infrastructure into your Dynatrace environment. OneAgent & cloud metrics.
Intelligent software automation combines cognitive and AI technologies, such as natural language processing, to build smart processes and workflows that learn, adapt, and improve with every IT software instance or digital transaction. Investigate network systems and application security incidents quickly for near-real-time remediation.
A new generation of automated solutions — designed to provide end-to-end observability of assets, applications, and performance across legacy and cloud systems — make that job easier, says Federal Chief Technology Officer Willie Hicks at Dynatrace. Or work with a contractor to build an AI system to identify problems on our network?
Both terms refer to technologies and practices, and both approaches aim to detect and pinpoint application performance issues before real users are impacted. Organizations can also optimize their infrastructure usage, achieving a better return on their technology spend. What is APM ? Application performance monitoring.
We organize all of the trending information in your field so you don't have to. Join 5,000+ users and stay up to date on the latest articles your peers are reading.
You know about us, now we want to get to know you!
Let's personalize your content
Let's get even more personalized
We recognize your account from another site in our network, please click 'Send Email' below to continue with verifying your account and setting a password.


Let's personalize your content