This site uses cookies to improve your experience. To help us insure we adhere to various privacy regulations, please select your country/region of residence. If you do not select a country, we will assume you are from the United States. Select your Cookie Settings or view our Privacy Policy and Terms of Use.
Cookie Settings
Cookies and similar technologies are used on this website for proper function of the website, for tracking performance analytics and for marketing purposes. We and some of our third-party providers may use cookie data for various purposes. Please review the cookie settings below and choose your preference.
Used for the proper function of the website
Used for monitoring website traffic and interactions
Cookie Settings
Cookies and similar technologies are used on this website for proper function of the website, for tracking performance analytics and for marketing purposes. We and some of our third-party providers may use cookie data for various purposes. Please review the cookie settings below and choose your preference.
Strictly Necessary: Used for the proper function of the website
Performance/Analytics: Used for monitoring website traffic and interactions
By Cheng Xie , Bryan Shultz , and Christine Xu In a previous blog post , we described how Netflix uses eBPF to capture TCP flow logs at scale for enhanced network insights. Delays and failures are inevitable in distributed systems, which may delay IP address change events from reaching FlowCollector.
The nirvana state of system uptime at peak loads is known as “five-nines availability.” In its pursuit, IT teams hover over system performance dashboards hoping their preparations will deliver five nines—or even four nines—availability. How can IT teams deliver system availability under peak loads that will satisfy customers?
Apache Spark is an open-source distributed computing system designed for large-scale data processing. It allows developers to write distributed applications using a simple and expressive programming model based on Resilient Distributed Datasets (RDDs). What Is Apache Spark?
It is not the end of programming. It is the end of programming as we know it today. Assembly language programming then put an end to that. Betty Jean Jennings and Frances Bilas (right) program the ENIAC in 1946. Consumer operating systems were also a big part of the story. The web was another end of programming.
They may stem from software bugs, cyberattacks, surges in demand, issues with backup processes, network problems, or human errors. Ransomware encrypts essential data, locking users out of systems and halting operations until a ransom is paid. Let’s explore each of these elements and what organizations can do to avoid them.
As we enter a new decade, we asked programming experts?—including We checked in with Jim Blandy , coauthor of Programming Rust , to see how his vision of Rust’s progress changed over the course of 2019. including several of our own O’Reilly authors and instructors?—for ” What lies ahead?
Python is a powerful and flexible programming language used by millions of developers around the world to build their applications. With MongoDB deployments, failovers aren’t considered major events as they were with traditional database management systems. So, what’s the best way to use MongoDB with Python?
Introduction to Message Brokers Message brokers enable applications, services, and systems to communicate by acting as intermediaries between senders and receivers. This decoupling simplifies system architecture and supports scalability in distributed environments.
Open Connect Open Connect is Netflix’s content delivery network (CDN). video streaming) takes place in the Open Connect network. Various software systems are needed to design, build, and operate this CDN infrastructure, and a significant number of them are written in Python. are you logged in?
They can also develop proactive security measures capable of stopping threats before they breach network defenses. For example, an organization might use security analytics tools to monitor user behavior and network traffic. Teams can then act before attackers have the chance to compromise key data or bring down critical systems.
A message queue is a form of middleware used in software development to enable communications between services, programs, and dissimilar components, such as operating systems and communication protocols. A message queue enables the smooth flow of information to make complex systems work.
A message queue is a form of middleware used in software development to enable communications between services, programs, and dissimilar components, such as operating systems and communication protocols. A message queue enables the smooth flow of information to make complex systems work.
Dynatrace tracks worst-case scenarios and business risks as part of its business continuity planning program. Access to source code repositories is limited on both the network and the user level. Source code management systems are only accessible from within the Dynatrace corporate network.
Therefore, they need an environment that offers scalable computing, storage, and networking. Hyperconverged infrastructure (HCI) is an IT architecture that combines servers, storage, and networking functions into a unified, software-centric platform to streamline resource management. What is hyperconverged infrastructure?
By virtue of the incredible volume, quality, scope (we actually go far beyond just application monitoring) and granularity of the data the platform provides, our customers have at their fingertips unparalleled insights about their systems, users, and so much more. On further examination you discover an abnormal system process has initiated.
There are a few important details worth unpacking around monolithic observability as it relates to these qualities: The nature of a monolithic application using a single programming language can ensure all code uses the exact same logging standards, location, and internal diagnostics. Just as the code is monolithic, so is the logging.
And it covers more than just applications, application programming interfaces, and microservices. Software analytics offers the ability to gain and share insights from data emitted by software systems and related operational processes to develop higher-quality software faster while operating it efficiently and securely.
On a recent SIGNAL webinar, guest Paul Puckett, Director of the Enterprise Cloud Management Agency (ECMA), shared the Army has created 178 integrated online systems in the last 10 years, 46 of which were established since 2020.
Supporting more modern cloud technologies and eco-system extensions than any other observability solution enables frictionless deployment and insights into the vast array of technologies enterprise customers are adopting: Key announcements. Partner Program update – new Ignite tier. Partner Competency Program.
As an example, let’s start with the waveform of a program, shown below in Figure 1. Example program waveform To measure a program’s dynamic range, we break the waveform into short segments, such as half-second intervals, and compute the RMS level of each segment in dBFS. or when switching to any other program.
When I worked at Google, fleet-wide profiling revealed that 25-35% of all CPU time was spent just moving bytes around: memcpy, strcmp, copying between user and kernel buffers in network and disk I/O, hidden copy-on-write in soft page faults, checksumming, compressing, decrypting, assembling/disassembling packets and HTML pages, etc.
Program staff depend on the reliable functioning of critical programsystems and infrastructure to provide the best service delivery to the communities and citizens HHS serves, from newborn infants to persons requiring health services to our oldest citizens.
Supporting more modern cloud technologies and eco-system extensions than any other observability solution enables frictionless deployment and insights into the vast array of technologies enterprise customers are adopting: Key announcements. Partner Program update – new Ignite tier. Partner Competency Program.
As a software intelligence platform, Dynatrace is woven into the fabric of your business systems, actively managing and providing self-healing capabilities for all aspects of your applications and vital infrastructure. Metrics are provided for general host info like CPU usage and memory consumption, OneAgent traffic, and network latency.
Application security monitoring is the practice of monitoring and analyzing applications or software systems to detect vulnerabilities, identify threats, and mitigate attacks. Forensics focuses on the systemic investigation and analysis of digital evidence to determine root causes.
The process involves monitoring various components of the software delivery pipeline, including applications, infrastructure, networks, and databases. In addition, monitoring DevOps processes provide the following benefits: Improve system performance. Help systems meet SLAs. Provide metrics for improved site reliability.
Let’s explore how a log auditing and log forensics program can benefit from the convergence of observability and security data. Log auditing is a cybersecurity practice that involves examining logs generated by various applications, computer systems, and network devices to identify and analyze security-related events.
The Network and Information Systems 2 (NIS2) Directive, which goes into effect in Oct 2024, aims to enhance the security of network and information systems throughout the EU. NIS2 is an evolution of the Network and Information Systems (NIS) Security Directive, which has been in effect since 2016.
If your application connects to the production database over a public network, do reach out to support@scalegrid.io There are two problems with adding the ScaleGrid Certificate to the Windows Trust Store: The settings apply to all programs running on the machine: this can be a security vulnerability. to learn more about this.
In summary, the Log4Shell vulnerability allows an attacker to instruct the vulnerable system to download, and subsequently execute, a malicious command. Sensitive Data Access – Do the vulnerable Java processes access critical databases or file systems in the environment? Application List – Which applications use these libraries?
A new generation of automated solutions — designed to provide end-to-end observability of assets, applications, and performance across legacy and cloud systems — make that job easier, says Federal Chief Technology Officer Willie Hicks at Dynatrace. They don’t have visibility or “observability” in their systems. What’s the root cause?
According to the Kubernetes in the Wild 2023 report, “Kubernetes is emerging as the operating system of the cloud.” Kubernetes also gives developers freedom of choice when selecting operating systems, container runtimes, storage engines, and other key elements for their Kubernetes environments. Networking.
DORA seeks to strengthen the cybersecurity resilience of the EU’s banking and financial institutions by requiring them to possess the requisite processes, systems, and controls to prevent, manage, and recover from cybersecurity incidents. This helps assess the ability of systems and processes to withstand disruptions and recover quickly.
In summary, the Log4Shell exploit allows an attacker to instruct the vulnerable system to download, and subsequently execute, a malicious command. Sensitive Data Access – Do the vulnerable Java processes access critical databases or file systems in the environment? Application List – Which applications use these libraries?
Amplify PowerUP, our half-yearly global event to update our partner community, covered a lot of ground including key Partner Program announcements, Q2 earnings and partner contribution, market growth and momentum, Dynatrace platform capabilities, and the partner services offering the platform powers. Dynatrace news.
Whether deployment of a new system, a new release, or a rolling patch update, I wanted it done consistently and successfully every time. Because of the quantity of “proper noun solutions” I experienced in my System Administrator career, I wasn’t previously aware of the full spectrum of capabilities in Dynatrace.
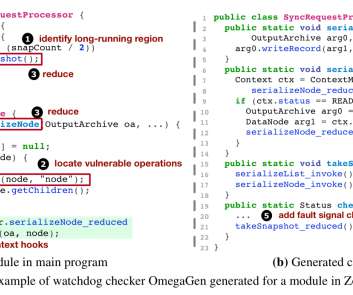
Understanding, detecting and localizing partial failures in large system software , Lou et al., Partial failures ( gray failures ) occur when some but not all of the functionalities of a system are broken. Here are the key findings: Partial failures appear throughout the release history of each system, 54% within the last three years.
This is because they are able to leverage free AWS or Azure startup hosting credits secured through their incubator, accelerator, or startup community program, and can apply their free credits to their database hosting costs as ScaleGrid. These are advanced cloud configurations that allow you to protect your databases from the internet.
The inspiration (and title) for it comes from Mike Loukides’ Radar article on Real World Programming with ChatGPT , which shares a similar spirit of digging into the potential and limits of AI tools for more realistic end-to-end programming tasks. Setting the Stage: Who Am I and What Am I Trying to Build?
BCLC is a government ministry corporation that provides lottery, casino, and sports betting services to benefit the province’s healthcare, education, and community programs. “A lot has changed and it’s a lot better now that we have a detailed view of how our players behave in the system.”
In this article, we’ll understand what consistent hashing is all about and why it is an essential tool in scalable distributed system architectures. Using a hash function, we ensured that resources required by computer programs could be stored in memory in an efficient manner, ensuring that in-memory data structures are loaded evenly.
The open-source scripting language PHP is used by over 78% of all websites that use a server-side programming language. PHP is widely used in web development by prominent social media companies, content management systems, and video teleconferencing brands. Dynatrace news. It ranks eighth in terms of GitHub pull requests statistics.
OpenTelemetry provides a set of vendor-agnostic application program interfaces (APIs) to create a common way to instrument applications and collect data from logs and traces across a wide variety of frameworks and languages. It uses standardized application program interfaces that a wide variety of vendors and user organizations can support.
If your customers don’t know what’s slowing them down, or why their Agile and DevOps transformations are hitting a wall, then the Flow Partner Program is for you. Now, with the revitalized Flow Partner Program , our partners can access the very latest solutions and training to enjoy the same success. . About the Flow Partner Program.
We organize all of the trending information in your field so you don't have to. Join 5,000+ users and stay up to date on the latest articles your peers are reading.
You know about us, now we want to get to know you!
Let's personalize your content
Let's get even more personalized
We recognize your account from another site in our network, please click 'Send Email' below to continue with verifying your account and setting a password.


Let's personalize your content