This site uses cookies to improve your experience. To help us insure we adhere to various privacy regulations, please select your country/region of residence. If you do not select a country, we will assume you are from the United States. Select your Cookie Settings or view our Privacy Policy and Terms of Use.
Cookie Settings
Cookies and similar technologies are used on this website for proper function of the website, for tracking performance analytics and for marketing purposes. We and some of our third-party providers may use cookie data for various purposes. Please review the cookie settings below and choose your preference.
Used for the proper function of the website
Used for monitoring website traffic and interactions
Cookie Settings
Cookies and similar technologies are used on this website for proper function of the website, for tracking performance analytics and for marketing purposes. We and some of our third-party providers may use cookie data for various purposes. Please review the cookie settings below and choose your preference.
Strictly Necessary: Used for the proper function of the website
Performance/Analytics: Used for monitoring website traffic and interactions
Applications and services are often slowed down by under-performing DNS communications or misconfigured DNS servers, which can result in frustrated customers uninstalling your application. While our competitors only provide generic traffic monitoring without artificial intelligence, Dynatrace automatically analyzes DNS-related anomalies.
Google has a pretty tight grip on the tech industry: it makes by far the most popular browser with the best DevTools, and the most popular search engine, which means that web developers spend most of their time in Chrome, most of their visitors are in Chrome, and a lot of their search traffic will be coming from Google. Why This Is a Problem.
For cloud operations teams, networkperformance monitoring is central in ensuring application and infrastructure performance. If the network is sluggish, an application may also be slow, frustrating users. Worse, a malicious attacker may gain access to the network, compromising sensitive application data.
Over the last 15+ years, Ive worked on designing APIs that are not only functional but also resilient able to adapt to unexpected failures and maintain performance under pressure. This has become critical since APIs serve as the backbone of todays interconnected systems.
Ensuring smooth operations is no small feat, whether you’re in charge of application performance, IT infrastructure, or business processes. For example, if you’re monitoring networktraffic and the average over the past 7 days is 500 Mbps, the threshold will adapt to this baseline.
How To Design For High-Traffic Events And Prevent Your Website From Crashing How To Design For High-Traffic Events And Prevent Your Website From Crashing Saad Khan 2025-01-07T14:00:00+00:00 2025-01-07T22:04:48+00:00 This article is sponsored by Cloudways Product launches and sales typically attract large volumes of traffic.
When 54 percent of the internet traffic share is accounted for by Mobile , it's certainly nontrivial to acknowledge how your app can make a difference to that of the competitor! Introduction.
System resilience stands as the key requirement for e-commerce platforms during scaling operations to keep services operational and deliver performance excellence to users. We have developed a microservices architecture platform that encounters sporadic system failures when faced with heavy traffic events.
Find and prevent application performance risks A major challenge for DevOps and security teams is responding to outages or poor application performance fast enough to maintain normal service. It should also be possible to analyze data in context to proactively address events, optimize performance, and remediate issues in real time.
Quick and easy network infrastructure monitoring. Begin network monitoring by simply deploying an extension with just a few clicks. The topology model for network devices covers simple to complex use cases from visualizing the interfaces of a router to mapping an F5 Big-IP LTM load balancer. Start monitoring in minutes.
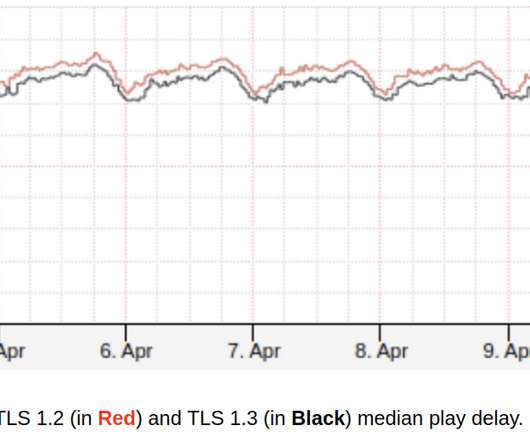
How Netflix brings safer and faster streaming experience to the living room on crowded networks using TLS 1.3 We want playback to start instantly and to never stop unexpectedly in any network environment. for streaming traffic. We use AES Galois/Counter Mode, as it also provides good performance and high throughput.
Scaling RabbitMQ ensures your system can handle growing traffic and maintain high performance. Optimizing RabbitMQ performance through strategies such as keeping queues short, enabling lazy queues, and monitoring health checks is essential for maintaining system efficiency and effectively managing high traffic loads.
The system could work efficiently with a specific number of concurrent users; however, it may get dysfunctional with extra loads during peak traffic. Performances testing helps establish the scalability, stability, and speed of the software application. Confirming scalability, dependability, stability, and speed of the app is crucial.
Lateral movement across the cluster With host access established, the attacker discovers that the cluster has no network policies defined. Missing network policies + inadequate namespace isolation Attack technique. All pods can communicate with each other across namespaces without restrictions. Misconfiguration. Misconfiguration.
Benefits of Caching Improved performance: Caching eliminates the need to retrieve data from the original source every time, resulting in faster response times and reduced latency. Bandwidth optimization: Caching reduces the amount of data transferred over the network, minimizing bandwidth usage and improving efficiency.
With the advent of cloud computing, managing networktraffic and ensuring optimal performance have become critical aspects of system architecture. Amazon Web Services (AWS), a leading cloud service provider, offers a suite of load balancers to manage networktraffic effectively for applications running on its platform.
Service meshes are becoming increasingly popular in cloud-native applications as they provide a way to manage networktraffic between microservices. It offers several features, including: Prioritized load shedding: Drops traffic that is deemed less important to ensure that the most critical traffic is served.
As monolithic applications have given way to cloud-connected microservices that perform distinct functions, containerized environments, such as the Kubernetes platform, have become the framework of choice. It controls the delivery of service requests to other services, performs load balancing, encrypts data, and discovers other services.
This blog post will share broadly-applicable techniques (beyond GraphQL) we used to perform this migration. The control group’s traffic utilized the legacy Falcor stack, while the experiment population leveraged the new GraphQL client and was directed to the GraphQL Shim. The Replay Tester tool samples raw traffic streams from Mantis.
They may stem from software bugs, cyberattacks, surges in demand, issues with backup processes, network problems, or human errors. Possible scenarios A Distributed Denial of Service (DDoS) attack overwhelms servers with traffic, making a website or service unavailable.
This open-source software, lauded for its reliability and high performance, is a vital tool in the arsenal of network administrators, adept at managing web traffic across diverse server environments. This functionality enhances web applications' overall performance and responsiveness and ensures a seamless user experience.
But, performance testing is a little tricky. If you sniff the traffic, you don't get any network data. If you are working on Shiny apps performance testing, then this blog article is for you. Data is ubiquitous. Shiny from R Studio helps to build interactive web applications from R.
This opens the door to auto-scalable applications, which effortlessly matches the demands of rapidly growing and varying user traffic. These mechanisms are often compared to a conductor directing an orchestra to perform elaborate symphonies and juicy operas for our enjoyment. Networking. What is Docker? Container deployment.
Without having network visibility, it’s not possible to improve our reliability, security and capacity posture. Network Availability: The expected continued growth of our ecosystem makes it difficult to understand our network bottlenecks and potential limits we may be reaching. 43416 5001 52.213.180.42 43416 5001 52.213.180.42
Our teams have seen application usage surge across our customer base, causing an urgent need for organizations to provide advanced observability for their applications to optimize user experiences and performance. Facilitating an understanding of traffic patterns and potential traffic spikes helps maintain customer experience.
The F5 BIG-IP Local Traffic Manager (LTM) is an application delivery controller (ADC) that ensures the availability, security, and optimal performance of networktraffic flows. Detect and respond to security threats like DDoS attacks or web application attacks by monitoring application traffic and logs.
In our Dynatrace Dashboard tutorial, we want to add a chart that shows the bytes in and out per host over time to enhance visibility into networktraffic. By tracking these metrics, we can identify any unusual spikes or drops in network activity, which might indicate performance issues or bottlenecks.
The network latency between cluster nodes should be around 10 ms or less. Minimized cross-data center networktraffic. – A Dynatrace customer, Head of Performance Engineering. Regular Dynatrace Managed deployments can work seamlessly when a maximum of two nodes are down at a time and the network has low latency.
For two decades, Dynatrace NAM—Network Application Monitoring, formerly known as DC RUM—has been successfully monitoring the user experience of our customers’ enterprise applications. Performance has always mattered. SNMP managed the costs of network links well, but not the sources of those costs (i.e., Dynatrace news.
With more organizations taking the multicloud plunge, monitoring cloud infrastructure is critical to ensure all components of the cloud computing stack are available, high-performing, and secure. These next-generation cloud monitoring tools present reports — including metrics, performance, and incident detection — visually via dashboards.
VPC Flow Logs is an Amazon service that enables IT pros to capture information about the IP traffic that traverses network interfaces in a virtual private cloud, or VPC. By default, each record captures a network internet protocol (IP), a destination, and the source of the traffic flow that occurs within your environment.
These include traditional on-premises network devices and servers for infrastructure applications like databases, websites, or email. A local endpoint in a protected network or DMZ is required to capture these messages. The key to success is making data in this complex ecosystem actionable, as many types of syslog producers exist.
Over the last two month s, w e’ve monito red key sites and applications across industries that have been receiving surges in traffic , including government, health insurance, retail, banking, and media. Breaking d own performance across U.S. On Thursday of that week, traffic increased to 153,000 sessions. .
As a Network Engineer, you need to ensure the operational functionality, availability, efficiency, backup/recovery, and security of your company’s network. With the new extension framework, thanks to our API-first approach, there are no operations to be performed in the web UI. Events and alerts.
By: Ankush Gulati , David Gevorkyan Additional credits: Michael Clark , Gokhan Ozer Intro Netflix has more than 220 million active members who perform a variety of actions throughout each session, ranging from renaming a profile to watching a title. This network connection heterogeneity made choosing a single delivery model difficult.
This new service enhances the user visibility of network details with direct delivery of Flow Logs for Transit Gateway to your desired endpoint via Amazon Simple Storage Service (S3) bucket or Amazon CloudWatch Logs. AWS Transit Gateway is a service offering from Amazon Web Services that connects network resources via a centralized hub.
To maintain the reliability, security, and performance of your microservices , you need a well-structured service mesh. Understanding Service Mesh A service mesh is essentially the invisible backbone of a network, connecting and empowering the various components of a microservices ecosystem.
The implications of software performance issues and outages have a significantly broader impact than in the past—with the potential to negatively impact revenue, customer experiences, patient outcomes, and, of course, brand reputation. With global e-commerce spending projected to reach $6.3
It enables users to perform any maintenance actions by providing pause/resume functionality. All of these tests were performed while the application was running and inserting data to the PostgreSQL database. Network Isolation Tests. Network-isolate the master server from other servers. How it Works. Test Scenario.
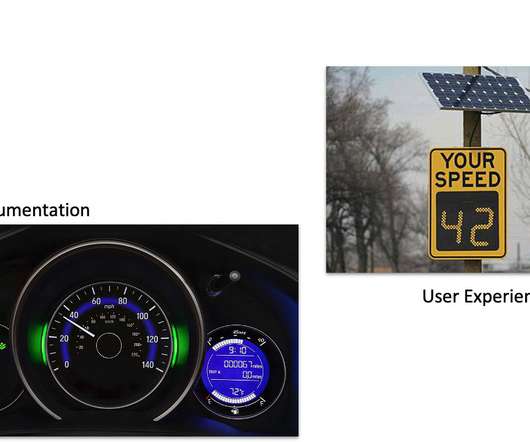
How viewers are able to watch their favorite show on Netflix while the infrastructure self-recovers from a system failure By Manuel Correa , Arthur Gonigberg , and Daniel West Getting stuck in traffic is one of the most frustrating experiences for drivers around the world. Logs and background requests are examples of this type of traffic.
Continuously monitoring application behavior, networktraffic, and system logs allows teams to identify abnormal or suspicious activities that could indicate a security breach. This process may involve behavioral analytics; real-time monitoring of networktraffic, user activity, and system logs; and threat intelligence.
Security vulnerabilities are weaknesses in applications, operating systems, networks, and other IT services and infrastructure that would allow an attacker to compromise a system, steal data, or otherwise disrupt IT operations. For example, an attacker could exploit a misconfigured firewall rule to gain access to servers on your network.
Native support for Syslog messages Syslog messages are generated by default in Linux and Unix operating systems, security devices, network devices, and applications such as web servers and databases. Native support for syslog messages extends our infrastructure log support to all Linux/Unix systems and network devices.
In addition, with 193M members and counting, there is a huge diversity in the networks that stream our content as well as in our members’ bandwidth. It is, thus, imperative that we are sensible in the use of the network and of the bandwidth we require. Yet, given its wide support, our H.264/AVC
We organize all of the trending information in your field so you don't have to. Join 5,000+ users and stay up to date on the latest articles your peers are reading.
You know about us, now we want to get to know you!
Let's personalize your content
Let's get even more personalized
We recognize your account from another site in our network, please click 'Send Email' below to continue with verifying your account and setting a password.


Let's personalize your content