This site uses cookies to improve your experience. To help us insure we adhere to various privacy regulations, please select your country/region of residence. If you do not select a country, we will assume you are from the United States. Select your Cookie Settings or view our Privacy Policy and Terms of Use.
Cookie Settings
Cookies and similar technologies are used on this website for proper function of the website, for tracking performance analytics and for marketing purposes. We and some of our third-party providers may use cookie data for various purposes. Please review the cookie settings below and choose your preference.
Used for the proper function of the website
Used for monitoring website traffic and interactions
Cookie Settings
Cookies and similar technologies are used on this website for proper function of the website, for tracking performance analytics and for marketing purposes. We and some of our third-party providers may use cookie data for various purposes. Please review the cookie settings below and choose your preference.
Strictly Necessary: Used for the proper function of the website
Performance/Analytics: Used for monitoring website traffic and interactions
We’re going to set out on a mind-blowing tour around network security. Upon considering the nearness and risk posed by cyber threats in this epoch, it is important to prevent the threats so that they do not cause irreversible damage within the network.
“Set it and forget it” is the approach that most network teams follow with their authoritative Domain Name System (DNS). If the system is working and end-users find network connections to revenue-generating applications, services, and content, then administrators will generally say that you shouldn’t mess with success.
As cloud networks continue to expand, security concerns become increasingly complex, making it critical to ensure robust protection without sacrificing performance. These advanced firewalls are integral to cloud security strategies, combining multiple layers of defense with optimized performance to tackle evolving threats.
Building performant services and systems is at the core of every business. Tons of technologies emerge daily, promising capabilities that help you surpass your performance benchmarks. However, production environments are chaotic landscapes that exact a heavy performance toll when not maintained and monitored.
By Alok Tiagi , Hariharan Ananthakrishnan , Ivan Porto Carrero and Keerti Lakshminarayan Netflix has developed a network observability sidecar called Flow Exporter that uses eBPF tracepoints to capture TCP flows at near real time. Without having network visibility, it’s difficult to improve our reliability, security and capacity posture.
For cloud operations teams, networkperformance monitoring is central in ensuring application and infrastructure performance. If the network is sluggish, an application may also be slow, frustrating users. Worse, a malicious attacker may gain access to the network, compromising sensitive application data.
By: Ankush Gulati , David Gevorkyan Additional credits: Michael Clark , Gokhan Ozer Intro Netflix has more than 220 million active members who perform a variety of actions throughout each session, ranging from renaming a profile to watching a title.
Over the last 15+ years, Ive worked on designing APIs that are not only functional but also resilient able to adapt to unexpected failures and maintain performance under pressure. This has become critical since APIs serve as the backbone of todays interconnected systems.
Clearly, continuing to depend on siloed systems, disjointed monitoring tools, and manual analytics is no longer sustainable. Find and prevent application performance risks A major challenge for DevOps and security teams is responding to outages or poor application performance fast enough to maintain normal service.
These releases often assumed ideal conditions such as zero latency, infinite bandwidth, and no network loss, as highlighted in Peter Deutsch’s eight fallacies of distributed systems. With Dynatrace, teams can seamlessly monitor the entire system, including network switches, database storage, and third-party dependencies.
JMeter Netconf Plug-in and Network Service Automation. Network service automation-related requirements are usually realized by means of commercial or open-source network orchestrator or controller software system. JMeter Netconf plug-in implementation includes two modules.
This is an article from DZone's 2023 Observability and Application Performance Trend Report. Power outages and network issues are common examples of challenges that can put your service — and your business — at risk.
In the changing world of data centers and cloud computing, the desire for efficient, flexible, and scalable networking solutions has resulted in the broad use of Software-Defined Networking (SDN). Traditional networking models have a tightly integrated control plane and data plane within network devices.
As HTTP and browser monitors cover the application level of the ISO /OSI model , successful executions of synthetic tests indicate that availability and performance meet the expected thresholds of your entire technological stack. Combined with Dynatrace OneAgent ® , you gain a precise view of the status of your systems at a glance.
System resilience stands as the key requirement for e-commerce platforms during scaling operations to keep services operational and deliver performance excellence to users. We have developed a microservices architecture platform that encounters sporadic system failures when faced with heavy traffic events.
Log management is an organization’s rules and policies for managing and enabling the creation, transmission, analysis, storage, and other tasks related to IT systems’ and applications’ log data. This is critical to ensure high performance, security, and a positive user experience for cloud-native applications and services.
EdgeConnect provides a secure bridge for SaaS-heavy companies like Dynatrace, which hosts numerous systems and data behind VPNs. In this hybrid world, IT and business processes often span across a blend of on-premises and SaaS systems, making standardization and automation necessary for efficiency.
Ensuring smooth operations is no small feat, whether you’re in charge of application performance, IT infrastructure, or business processes. For example, if you’re monitoring network traffic and the average over the past 7 days is 500 Mbps, the threshold will adapt to this baseline.
This is further exacerbated by the fact that a significant portion of their IT budgets are allocated to maintaining outdated legacy systems. By combining AI and observability, government agencies can create more intelligent and responsive systems that are better equipped to tackle the challenges of today and tomorrow.
Whether you’re a seasoned IT expert or a marketing professional looking to improve business performance, understanding the data available to you is essential. With Dashboards , you can monitor business performance, user interactions, security vulnerabilities, IT infrastructure health, and so much more, all in real time.
Microsoft Hyper-V is a virtualization platform that manages virtual machines (VMs) on Windows-based systems. It enables multiple operating systems to run simultaneously on the same physical hardware and integrates closely with Windows-hosted services. This leads to a more efficient and streamlined experience for users.
Mobile applications (apps) are an increasingly important channel for reaching customers, but the distributed nature of mobile app platforms and delivery networks can cause performance problems that leave users frustrated, or worse, turning to competitors. What is mobile app performance?
The nirvana state of system uptime at peak loads is known as “five-nines availability.” In its pursuit, IT teams hover over systemperformance dashboards hoping their preparations will deliver five nines—or even four nines—availability. How can IT teams deliver system availability under peak loads that will satisfy customers?
Scaling RabbitMQ ensures your system can handle growing traffic and maintain high performance. Key Takeaways RabbitMQ improves scalability and fault tolerance in distributed systems by decoupling applications, enabling reliable message exchanges.
This extends Dynatrace visibility into Citrix user experience and Citrix platform performance. Therefore, it requires multidimensional and multidisciplinary monitoring: Infrastructure health —automatically monitor the compute, storage, and network resources available to the Citrix system to ensure a stable platform. Citrix VDA.
This allows you to build customized visualizations with Dashboards or perform in-depth analysis with Notebooks. But nowadays, with complex and dynamically changing modern IT systems, the last result details might not be enough in some cases. It now fully supports not only Network Availability Monitors but also HTTP synthetic monitors.
Scalability is a fundamental concept in both technology and business that refers to the ability of a system, network, or organization to handle a growing amount of requests or ability to grow. This characteristic is crucial for maintaining performance and efficiency as need increases.
The system could work efficiently with a specific number of concurrent users; however, it may get dysfunctional with extra loads during peak traffic. Performances testing helps establish the scalability, stability, and speed of the software application. Confirming scalability, dependability, stability, and speed of the app is crucial.
They may stem from software bugs, cyberattacks, surges in demand, issues with backup processes, network problems, or human errors. Ransomware encrypts essential data, locking users out of systems and halting operations until a ransom is paid. Let’s explore each of these elements and what organizations can do to avoid them.
This article outlines the key differences in architecture, performance, and use cases to help determine the best fit for your workload. Introduction to Message Brokers Message brokers enable applications, services, and systems to communicate by acting as intermediaries between senders and receivers.
With the advent of cloud computing, managing network traffic and ensuring optimal performance have become critical aspects of system architecture. Amazon Web Services (AWS), a leading cloud service provider, offers a suite of load balancers to manage network traffic effectively for applications running on its platform.
Greenplum uses an MPP database design that can help you develop a scalable, high performance deployment. High performance, query optimization, open source and polymorphic data storage are the major Greenplum advantages. The MPP system leverages a shared-nothing architecture to handle multiple operations in parallel. Open Source.
In our Dynatrace Dashboard tutorial, we want to add a chart that shows the bytes in and out per host over time to enhance visibility into network traffic. By tracking these metrics, we can identify any unusual spikes or drops in network activity, which might indicate performance issues or bottlenecks. Expand the Trend section.
Dynatrace is the leading Software Intelligence Platform, focused on web-scale cloud monitoring, delivering the richest, most complete data sets in the Application Performance Management market. These insights are critical to ensuring proactive application monitoring and optimal systemperformance.
Efficient device management allows organizations to handle this vast network without hitches. Core Functions of IoT Device Management Provisioning and authentication : This is the initial phase, where a device is introduced into the system. Secure cryptographic methods establish its identity and grant it access to the network.
Native support for Syslog messages Syslog messages are generated by default in Linux and Unix operating systems, security devices, network devices, and applications such as web servers and databases. Native support for syslog messages extends our infrastructure log support to all Linux/Unix systems and network devices.
Service meshes are becoming increasingly popular in cloud-native applications as they provide a way to manage network traffic between microservices. Intelligent autoscaling: Adjusts resource allocation based on demand and performance. Istio, one of the most popular service meshes, uses Envoy as its data plane.
A distributed storage system is foundational in today’s data-driven landscape, ensuring data spread over multiple servers is reliable, accessible, and manageable. This guide delves into how these systems work, the challenges they solve, and their essential role in businesses and technology.
This transition to public, private, and hybrid cloud is driving organizations to automate and virtualize IT operations to lower costs and optimize cloud processes and systems. Besides the traditional system hardware, storage, routers, and software, ITOps also includes virtual components of the network and cloud infrastructure.
A log is a detailed, timestamped record of an event generated by an operating system, computing environment, application, server, or network device. Logs can include data about user inputs, system processes, and hardware states. Optimized systemperformance. What is log monitoring? Increased collaboration.
from a client it performs two parallel operations: i) persisting the action in the data store ii) publish the action in a streaming data store for a pub-sub model. User Feed Service, Media Counter Service) read the actions from the streaming data store and performs their specific tasks. System Components. References.
The implications of software performance issues and outages have a significantly broader impact than in the past—with the potential to negatively impact revenue, customer experiences, patient outcomes, and, of course, brand reputation. With global e-commerce spending projected to reach $6.3
Today, IT services have a direct impact on almost every key business performance indicator, from revenue and conversions to customer satisfaction and operational efficiency. In today’s digital-first world, data resides across dozens of different IT systems, from critical business applications to the modern cloud platforms that underpin them.
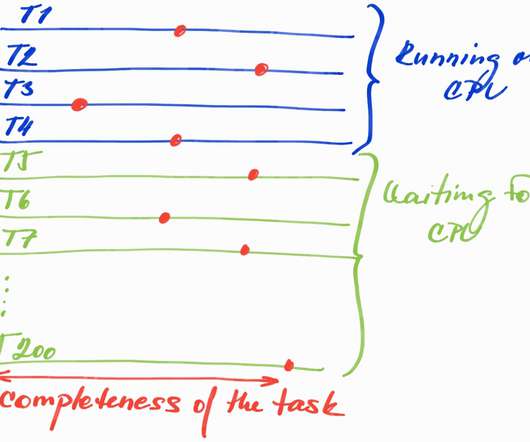
To achieve this, we often need to make changes in the settings of created network sockets and default settings of Linux kernel, monitor the usage of the TCP Send/Receive Buffers and Queues and, in particular, adjust our application to be a good candidate for solving this problem.
We organize all of the trending information in your field so you don't have to. Join 5,000+ users and stay up to date on the latest articles your peers are reading.
You know about us, now we want to get to know you!
Let's personalize your content
Let's get even more personalized
We recognize your account from another site in our network, please click 'Send Email' below to continue with verifying your account and setting a password.


Let's personalize your content