This site uses cookies to improve your experience. To help us insure we adhere to various privacy regulations, please select your country/region of residence. If you do not select a country, we will assume you are from the United States. Select your Cookie Settings or view our Privacy Policy and Terms of Use.
Cookie Settings
Cookies and similar technologies are used on this website for proper function of the website, for tracking performance analytics and for marketing purposes. We and some of our third-party providers may use cookie data for various purposes. Please review the cookie settings below and choose your preference.
Used for the proper function of the website
Used for monitoring website traffic and interactions
Cookie Settings
Cookies and similar technologies are used on this website for proper function of the website, for tracking performance analytics and for marketing purposes. We and some of our third-party providers may use cookie data for various purposes. Please review the cookie settings below and choose your preference.
Strictly Necessary: Used for the proper function of the website
Performance/Analytics: Used for monitoring website traffic and interactions
Applications and services are often slowed down by under-performing DNS communications or misconfigured DNS servers, which can result in frustrated customers uninstalling your application. Ensure high quality network traffic by tracking DNS requests out-of-the-box. Identify under-performing DNS servers.
Quick and easy network infrastructure monitoring. Begin network monitoring by simply deploying an extension with just a few clicks. The topology model for network devices covers simple to complex use cases from visualizing the interfaces of a router to mapping an F5 Big-IP LTM load balancer. Virtual servers. Pool nodes.
This open-source software, lauded for its reliability and high performance, is a vital tool in the arsenal of network administrators, adept at managing web traffic across diverse server environments. This functionality enhances web applications' overall performance and responsiveness and ensures a seamless user experience.
MySQL does not limit the number of slaves that you can connect to the master server in a replication topology. If the data churn on the master is high, the serving of binary logs alone could saturate the network interface of the master. Ripple is an open source binlog server developed by Pavel Ivanov.
As HTTP and browser monitors cover the application level of the ISO /OSI model , successful executions of synthetic tests indicate that availability and performance meet the expected thresholds of your entire technological stack. Are all network devices up and running, and is the network providing reliable and swift access to your systems?
This extends Dynatrace visibility into Citrix user experience and Citrix platform performance. Citrix is a sophisticated, efficient, and highly scalable application delivery platform that is itself comprised of anywhere from hundreds to thousands of servers. Dynatrace Extension: SAP ABAP platform performance. SAP server.
Time To First Byte: Beyond Server Response Time Time To First Byte: Beyond Server Response Time Matt Zeunert 2025-02-12T17:00:00+00:00 2025-02-13T01:34:15+00:00 This article is sponsored by DebugBear Loading your website HTML quickly has a big impact on visitor experience. TCP: Establishing a reliable connection to the server.
We continue to grow our public synthetic monitoring locations, but customers using Dynatrace Synthetic still need to monitor the performance and availability of internal web applications. Now, you’ll be able to: Measure internal web page performance and availability with single-URL monitors. ActiveGate OS: Ubuntu Server 16.04
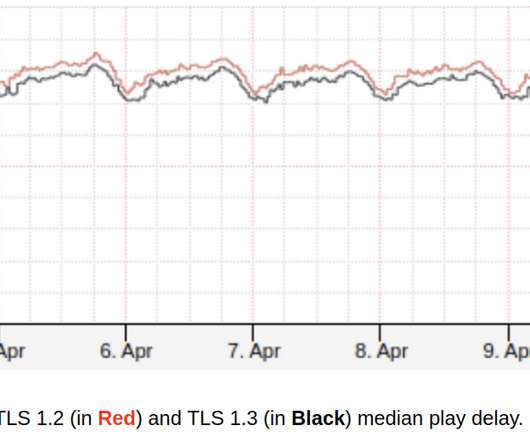
How Netflix brings safer and faster streaming experience to the living room on crowded networks using TLS 1.3 We want playback to start instantly and to never stop unexpectedly in any network environment. We use AES Galois/Counter Mode, as it also provides good performance and high throughput. With TLS 1.3, Also in TLS 1.2,
Whether you’re a seasoned IT expert or a marketing professional looking to improve business performance, understanding the data available to you is essential. With Dashboards , you can monitor business performance, user interactions, security vulnerabilities, IT infrastructure health, and so much more, all in real time.
Today’s applications are cloud-native, microservices-based, and extend across both the cloud and on-premises servers. This blog originally appeared in Federal News Network. The post How AI and observability help to safeguard government networks from new threats appeared first on Dynatrace news.
Benefits of Caching Improved performance: Caching eliminates the need to retrieve data from the original source every time, resulting in faster response times and reduced latency. Reduced server load: By serving cached content, the load on the server is reduced, allowing it to handle more requests and improving overall scalability.
Firstly, managing virtual networks can be complex as networking in a virtual environment differs significantly from traditional networking. Secondly, determining the correct allocation of resources (CPU, memory, storage) to each virtual machine to ensure optimal performance without over-provisioning can be difficult.
It enables users to perform any maintenance actions by providing pause/resume functionality. All of these tests were performed while the application was running and inserting data to the PostgreSQL database. Standby Server Tests. Reboot the server. patronictl list did not display this server. Reboot the server.
What Are Virtual Network Functions (VNFs)? Previously, proprietary hardware performed functions like routers, firewalls, load balancers, etc. VNFs are virtualized network services that are packaged as virtual machines (VMs) on commodity hardware. These hardware functions are packaged as virtual machine images in a VNF.
It can scale towards a multi-petabyte level data workload without a single issue, and it allows access to a cluster of powerful servers that will work together within a single SQL interface where you can view all of the data. Greenplum uses an MPP database design that can help you develop a scalable, high performance deployment.
If you work with SAP ABAP, you may have noticed that finding information about SAP application and transaction performance involves scaling a high barrier to entry. While powerful, SAP performance management tools like the SAP Solution Manager are also complex. Assess problem impact and focus on the pressing issues first.
With more organizations taking the multicloud plunge, monitoring cloud infrastructure is critical to ensure all components of the cloud computing stack are available, high-performing, and secure. These next-generation cloud monitoring tools present reports — including metrics, performance, and incident detection — visually via dashboards.
While there are still quite a lot of cases where it is still applicable, it needs to evolve into more sophisticated processes tightly integrated with development and other parts of performance engineering. That dictates changes needed in performance testing (and, eventually, performance testing tools).
With the advent of cloud computing, managing network traffic and ensuring optimal performance have become critical aspects of system architecture. Amazon Web Services (AWS), a leading cloud service provider, offers a suite of load balancers to manage network traffic effectively for applications running on its platform.
In the recently published Gartner® “ Critic al Capabilities for Application Performance Monitoring and Observability,” Dynatrace scored highest for the IT Operations Use Case (4.15/5) This is accomplished by using service monitoring and anomaly detection for early-warning notifications of performance issues.” 5) in the Gartner report.
Amazon’s new general-purpose Linux for AWS is designed to provide a secure, stable, and high-performance execution environment to develop and run cloud applications. This is done by detecting availability and performance problems in real time across an entire technology stack while presenting teams with answers — not alert storms.
Therefore, they need an environment that offers scalable computing, storage, and networking. Hyperconverged infrastructure (HCI) is an IT architecture that combines servers, storage, and networking functions into a unified, software-centric platform to streamline resource management. What is hyperconverged infrastructure?
When you ask performance management vendors, “Does your solution work with SAP?,” Dynatrace is the only performance management product that has earned its position in the SAP App Center and has been chosen by the SAP Commerce Cloud for observability, monitoring, and performance management. Dynatrace news.
For two decades, Dynatrace NAM—Network Application Monitoring, formerly known as DC RUM—has been successfully monitoring the user experience of our customers’ enterprise applications. Performance has always mattered. SNMP managed the costs of network links well, but not the sources of those costs (i.e., Dynatrace news.
They may stem from software bugs, cyberattacks, surges in demand, issues with backup processes, network problems, or human errors. Possible scenarios A Distributed Denial of Service (DDoS) attack overwhelms servers with traffic, making a website or service unavailable.
Managing High Availability (HA) in your PostgreSQL hosting is very important to ensuring your database deployment clusters maintain exceptional uptime and strong operational performance so your data is always available to your application. The primary server is responsible for handling all write operations and maintaining data accuracy.
These include traditional on-premises network devices and servers for infrastructure applications like databases, websites, or email. A local endpoint in a protected network or DMZ is required to capture these messages. To enable syslog collection on an ActiveGate host, one change to extensionsuser.conf is required.
Besides the traditional system hardware, storage, routers, and software, ITOps also includes virtual components of the network and cloud infrastructure. The primary goal of ITOps is to provide a high-performing, consistent IT environment. Performance. What does IT operations do?
Application Performance Monitoring (APM) in its simplest terms is what practitioners use to ensure consistent availability, performance, and response times to applications. APM can also be referred to as: Application performance management. Performance monitoring. Dynatrace news. Application monitoring.
This blog post will share broadly-applicable techniques (beyond GraphQL) we used to perform this migration. Before GraphQL: Monolithic Falcor API implemented and maintained by the API Team Before moving to GraphQL, our API layer consisted of a monolithic server built with Falcor. To launch Phase 1 safely, we used AB Testing.
Citrix is a sophisticated, efficient, and highly scalable application delivery platform that is itself comprised of anywhere from hundreds to thousands of servers. Platform performance —get visibility into the performance of the Citrix platform to optimize application delivery. Dynatrace Extension: SAP ABAP platform performance.
To keep infrastructure and bare metal servers running smoothly, a long list of additional devices are used, such as UPS devices, rack cases that provide their own cooling, power sources, and other measures that are designed to prevent failures. But manual configuration of observability for systems like this is nearly impossible.
Too many concurrent server requests can lead to website crashes if youre not equipped to deal with them. How To Design For High-Traffic Events Lets take a look at six ways to design websites for high-traffic events, without worrying about website crashes and other performance-related issues. Lets jump right in!
The F5 BIG-IP Local Traffic Manager (LTM) is an application delivery controller (ADC) that ensures the availability, security, and optimal performance of network traffic flows. The LTM pool members represent your application and web servers, which can be effortlessly monitored with OneAgent ®.
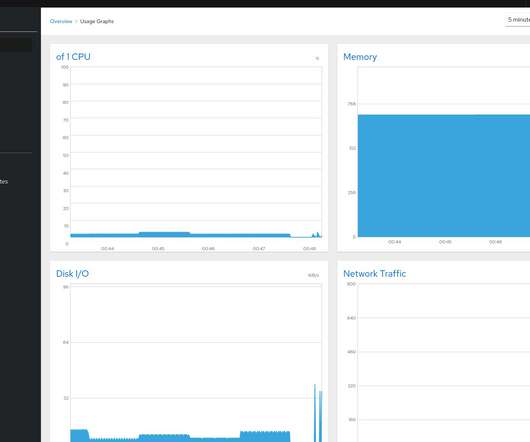
I needed basic information on RAM, CPU, Disk, Networking, and I/O to assess the performance bottleneck for the serve. Run your own Video Conference Service with Jitsi , I started looking for a reliable solution to monitor my instance that runs Jitsi. I was familiar with the tools I used in the past, like Cacti , Nagios , and Zabbix.
If you work with SAP ABAP, you may have noticed that finding information about SAP application and transaction performance involves scaling a high barrier to entry. While powerful, SAP performance management tools like the SAP Solution Manager are also complex. Assess problem impact and focus on the pressing issues first.
So many default to Amazon RDS, when MySQL performs exceptionally well on Azure Cloud. In this post, we outline the best way to host MySQL on Azure , including managed solutions, instance types, high availability replication, backup, and disk types to use to optimize your cloud database performance. Azure Virtual Networks.
A standard Docker container can run anywhere, on a personal computer (for example, PC, Mac, Linux), in the cloud, on local servers, and even on edge devices. Running containers : Docker Engine is a container runtime that runs in almost any environment: Mac and Windows PCs, Linux and Windows servers, the cloud, and on edge devices.
You get all the multicore Anna performance you want, but you don’t pay for what you don’t need. Just to throw out some numbers, we measured Anna providing 355x the performance of DynamoDB for the dollar. Each storage server collects statistics about the requests it serves, the data it stores, etc.
Datacenter - data center failure where the whole DC could become unavailable due to power failure, network connectivity failure, environmental catastrophe, etc. Redundancy in power, network, cooling systems, and possibly everything else relevant. Monitor the servers on various parameters and build redundancy.
With almost 100 public locations worldwide, Dynatrace Synthetic Monitoring enables 24/7 measurement of the availability and performance of your applications as experienced by your customers and coworkers worldwide. You can deploy private Synthetic locations at various points within your company network and then execute monitors from them.
They collect data from multiple sources through real user monitoring , synthetic monitoring, network monitoring, and application performance monitoring systems. Prioritize monitoring efforts to ensure the performance metrics align with your organization’s goals and user expectations. Time to first byte. Time to render.
Native support for Syslog messages Syslog messages are generated by default in Linux and Unix operating systems, security devices, network devices, and applications such as web servers and databases. Native support for syslog messages extends our infrastructure log support to all Linux/Unix systems and network devices.
We organize all of the trending information in your field so you don't have to. Join 5,000+ users and stay up to date on the latest articles your peers are reading.
You know about us, now we want to get to know you!
Let's personalize your content
Let's get even more personalized
We recognize your account from another site in our network, please click 'Send Email' below to continue with verifying your account and setting a password.


Let's personalize your content