This site uses cookies to improve your experience. To help us insure we adhere to various privacy regulations, please select your country/region of residence. If you do not select a country, we will assume you are from the United States. Select your Cookie Settings or view our Privacy Policy and Terms of Use.
Cookie Settings
Cookies and similar technologies are used on this website for proper function of the website, for tracking performance analytics and for marketing purposes. We and some of our third-party providers may use cookie data for various purposes. Please review the cookie settings below and choose your preference.
Used for the proper function of the website
Used for monitoring website traffic and interactions
Cookie Settings
Cookies and similar technologies are used on this website for proper function of the website, for tracking performance analytics and for marketing purposes. We and some of our third-party providers may use cookie data for various purposes. Please review the cookie settings below and choose your preference.
Strictly Necessary: Used for the proper function of the website
Performance/Analytics: Used for monitoring website traffic and interactions
We’re going to set out on a mind-blowing tour around network security. Upon considering the nearness and risk posed by cyber threats in this epoch, it is important to prevent the threats so that they do not cause irreversible damage within the network.
It’s worth noting that, by and large, the same page will perform better in iOS Safari than it would on Android Chrome— iPhones are generally far more powerful than their Android counterparts. WebPageTest is easily, by far, without a shadow of a doubt, the single most important tool when it comes to web performance. It’s vital.
Some are discouraged by the complexity of TCP/IP networking literature, while others are misled by confusing details in Wireshark. For instance, a DBA facing performance problems might misinterpret packet capture data in Wireshark, erroneously concluding that TCP retransmissions are the cause.
“Set it and forget it” is the approach that most network teams follow with their authoritative Domain Name System (DNS). If the system is working and end-users find network connections to revenue-generating applications, services, and content, then administrators will generally say that you shouldn’t mess with success.
Expectations for network monitoring In today’s digital landscape, businesses rely heavily on their IT infrastructure to deliver seamless services to customers. However, network issues can lead to significant downtime, affecting user experience and business operations.
As cloud networks continue to expand, security concerns become increasingly complex, making it critical to ensure robust protection without sacrificing performance. These advanced firewalls are integral to cloud security strategies, combining multiple layers of defense with optimized performance to tackle evolving threats.
By Alok Tiagi , Hariharan Ananthakrishnan , Ivan Porto Carrero and Keerti Lakshminarayan Netflix has developed a network observability sidecar called Flow Exporter that uses eBPF tracepoints to capture TCP flows at near real time. Without having network visibility, it’s difficult to improve our reliability, security and capacity posture.
For cloud operations teams, networkperformance monitoring is central in ensuring application and infrastructure performance. If the network is sluggish, an application may also be slow, frustrating users. Worse, a malicious attacker may gain access to the network, compromising sensitive application data.
Building performant services and systems is at the core of every business. Tons of technologies emerge daily, promising capabilities that help you surpass your performance benchmarks. However, production environments are chaotic landscapes that exact a heavy performance toll when not maintained and monitored.
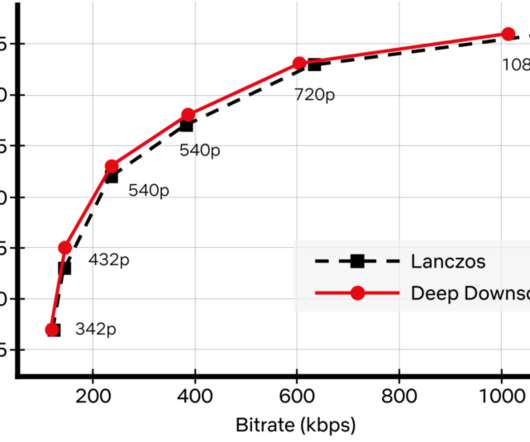
Recently, we added another powerful tool to our arsenal: neural networks for video downscaling. In this tech blog, we describe how we improved Netflix video quality with neural networks, the challenges we faced and what lies ahead. How can neural networks fit into Netflix video encoding?
It’s one of the best tools out there for diagnosing and improving the performance of your web applications. You can use it to track loading times, optimize CSS and JavaScript , and inspect network activity. But there’s an important piece of performance data that DevTools doesn’t yet expose by default: Long Animation Frames (LoAFs).
As a frontend developer or QA, we want to test our website performance in different network conditions and with different API latencies too. Here are some scenarios where you would like to delay the network requests. Testing certain components of web applications requires simulating delay in one or more web app components.
PolyScale operates a global network of PoPs (Points of Presence). This versatility provides a cost-effective solution to reduce global network latency by bringing the database closer to the end user. The network of PoPs spans multiple cloud providers , thereby bridging the gap between cloud providers.
Quick and easy network infrastructure monitoring. Begin network monitoring by simply deploying an extension with just a few clicks. The topology model for network devices covers simple to complex use cases from visualizing the interfaces of a router to mapping an F5 Big-IP LTM load balancer. Start monitoring in minutes.
As HTTP and browser monitors cover the application level of the ISO /OSI model , successful executions of synthetic tests indicate that availability and performance meet the expected thresholds of your entire technological stack. Are all network devices up and running, and is the network providing reliable and swift access to your systems?
Monitoring modern IT infrastructure is difficult, sometimes impossible, without advanced network monitoring tools. While the market is saturated with many Network Administrator support solutions, Dynatrace can help you analyze the impact on your organization in an automated manner. Sample SNMP-enabled device configuration. What’s next?
By utilizing Application Security Modules, which allow agencies to safeguard applications at runtime for automatic and continuous protection, you’ll have the best of both worlds: Applications running at peak performance without vulnerabilities, made possible by highly scalable application security solutions.
Over the last 15+ years, Ive worked on designing APIs that are not only functional but also resilient able to adapt to unexpected failures and maintain performance under pressure. This has become critical since APIs serve as the backbone of todays interconnected systems.
This allows platform engineers to focus on high-value tasks like resolving issues and optimizing performance rather than spending time on data discovery and exploration. An example of this is shown in the video above, where we incorporated network-related metrics into the Kubernetes cluster dashboard.
Find and prevent application performance risks A major challenge for DevOps and security teams is responding to outages or poor application performance fast enough to maintain normal service. It should also be possible to analyze data in context to proactively address events, optimize performance, and remediate issues in real time.
Ensuring smooth operations is no small feat, whether you’re in charge of application performance, IT infrastructure, or business processes. For example, if you’re monitoring network traffic and the average over the past 7 days is 500 Mbps, the threshold will adapt to this baseline.
Mobile applications (apps) are an increasingly important channel for reaching customers, but the distributed nature of mobile app platforms and delivery networks can cause performance problems that leave users frustrated, or worse, turning to competitors. What is mobile app performance? Issue remediation.
Firstly, managing virtual networks can be complex as networking in a virtual environment differs significantly from traditional networking. Secondly, determining the correct allocation of resources (CPU, memory, storage) to each virtual machine to ensure optimal performance without over-provisioning can be difficult.
System resilience stands as the key requirement for e-commerce platforms during scaling operations to keep services operational and deliver performance excellence to users. We have developed a microservices architecture platform that encounters sporadic system failures when faced with heavy traffic events.
In the ever-evolving landscape of cybersecurity, Network Access Control (NAC) stands out as a critical technology and process for authenticating and authorizing users on a private or corporate network.
What Are Virtual Network Functions (VNFs)? Previously, proprietary hardware performed functions like routers, firewalls, load balancers, etc. VNFs are virtualized network services that are packaged as virtual machines (VMs) on commodity hardware. These hardware functions are packaged as virtual machine images in a VNF.
Whether you’re a seasoned IT expert or a marketing professional looking to improve business performance, understanding the data available to you is essential. With Dashboards , you can monitor business performance, user interactions, security vulnerabilities, IT infrastructure health, and so much more, all in real time.
With the constant evolution of this sector, the dynamic duo of AI and ML is revolutionizing the telecommunications industry, propelling it towards greater network efficiency, unparalleled customer service, and fortified security measures. Here's an example of how machine learning can optimize networkperformance:
In the changing world of data centers and cloud computing, the desire for efficient, flexible, and scalable networking solutions has resulted in the broad use of Software-Defined Networking (SDN). Traditional networking models have a tightly integrated control plane and data plane within network devices.
However, the process for effectively scaling Elasticsearch can be nuanced, since one needs a proper understanding of the architecture behind it and of performance tradeoffs. This extra network overhead will easily result in increased latency compared to a single-node architecture where data access is straightforward.
Let's kick off the new year by celebrating someone who has not just had a huge impact on web performance over the past few years, but who has even more exciting stuff in the works for the future: Annie Sullivan! Annie and her team navigate this arduous task with true passion for web performance and for improving the user experience.
Benefits of Caching Improved performance: Caching eliminates the need to retrieve data from the original source every time, resulting in faster response times and reduced latency. Bandwidth optimization: Caching reduces the amount of data transferred over the network, minimizing bandwidth usage and improving efficiency.
Scalability is a fundamental concept in both technology and business that refers to the ability of a system, network, or organization to handle a growing amount of requests or ability to grow. This characteristic is crucial for maintaining performance and efficiency as need increases.
Scaling RabbitMQ ensures your system can handle growing traffic and maintain high performance. Optimizing RabbitMQ performance through strategies such as keeping queues short, enabling lazy queues, and monitoring health checks is essential for maintaining system efficiency and effectively managing high traffic loads.
Zhejiang Lab is a research institute in China, focusing on intelligent sensing, AI, computing, and networks. We tried two solutions: object storage with s3fs + network-attached storage (NAS) and Alluxio + Fluid + object storage , but they had limitations and performance issues.
This allows you to build customized visualizations with Dashboards or perform in-depth analysis with Notebooks. It now fully supports not only Network Availability Monitors but also HTTP synthetic monitors. The new Dynatrace Synthetic app allows you to analyze these results.
In the recently published Gartner® “ Critic al Capabilities for Application Performance Monitoring and Observability,” Dynatrace scored highest for the IT Operations Use Case (4.15/5) This is accomplished by using service monitoring and anomaly detection for early-warning notifications of performance issues.” 5) in the Gartner report.
When it comes to mobile monitoring, everyone has their own point of view… Mobile is not a single technology: it involves different development teams handling Android and iOS apps, performance engineering teams, cloud operations, and marketing. How do I connect the dots between mobile analytics and performance monitoring?
This marked a significant improvement in its networking infrastructure. The Journey to HTTP/3 Networkperformance, such as low latency and high throughput, is critical to Pinners’ experience. In a recent announcement, Pinterest revealed its successful migration from HTTP/2 to HTTP/3.
With more organizations taking the multicloud plunge, monitoring cloud infrastructure is critical to ensure all components of the cloud computing stack are available, high-performing, and secure. These next-generation cloud monitoring tools present reports — including metrics, performance, and incident detection — visually via dashboards.
They may stem from software bugs, cyberattacks, surges in demand, issues with backup processes, network problems, or human errors. Conducting performance testing and having contingency plans for peak times can help ensure systems remain operational during spikes in usage.
What I got back were two artifacts, one of them being the following video of Akamai web performance expert Robin Marx speaking at We Love Speed in France a few weeks ago: The other artifact is a Google document originally published by Patrick Meenan in 2015 but updated somewhat recently in November 2023.
With the advent of cloud computing, managing network traffic and ensuring optimal performance have become critical aspects of system architecture. Amazon Web Services (AWS), a leading cloud service provider, offers a suite of load balancers to manage network traffic effectively for applications running on its platform.
These include traditional on-premises network devices and servers for infrastructure applications like databases, websites, or email. A local endpoint in a protected network or DMZ is required to capture these messages. The key to success is making data in this complex ecosystem actionable, as many types of syslog producers exist.
We organize all of the trending information in your field so you don't have to. Join 5,000+ users and stay up to date on the latest articles your peers are reading.
You know about us, now we want to get to know you!
Let's personalize your content
Let's get even more personalized
We recognize your account from another site in our network, please click 'Send Email' below to continue with verifying your account and setting a password.


Let's personalize your content