This site uses cookies to improve your experience. To help us insure we adhere to various privacy regulations, please select your country/region of residence. If you do not select a country, we will assume you are from the United States. Select your Cookie Settings or view our Privacy Policy and Terms of Use.
Cookie Settings
Cookies and similar technologies are used on this website for proper function of the website, for tracking performance analytics and for marketing purposes. We and some of our third-party providers may use cookie data for various purposes. Please review the cookie settings below and choose your preference.
Used for the proper function of the website
Used for monitoring website traffic and interactions
Cookie Settings
Cookies and similar technologies are used on this website for proper function of the website, for tracking performance analytics and for marketing purposes. We and some of our third-party providers may use cookie data for various purposes. Please review the cookie settings below and choose your preference.
Strictly Necessary: Used for the proper function of the website
Performance/Analytics: Used for monitoring website traffic and interactions
As a result, API monitoring has become a must for DevOps teams. So what is API monitoring? What is API Monitoring? API monitoring is the process of collecting and analyzing data about the performance of an API in order to identify problems that impact users. The need for API monitoring. Ways to monitor APIs.
Observability has become a hot topic these days in the world of monitoring. In this video series, Nancy Gohring, Senior Analyst at 451 Research , answers your questions about observability and application monitoring. What is observability and how is it different from traditional monitoring? Blog post: What is? OpenTelemetry??Everything
As businesses compete for customer loyalty, it’s critical to understand the difference between real-user monitoring and synthetic user monitoring. However, not all user monitoring systems are created equal. What is real user monitoring? Real-time monitoring of user application and service interactions.
Cloud integration and application performance monitoring at the federal level is in full force. On a recent SIGNAL webinar, guest Paul Puckett, Director of the Enterprise Cloud Management Agency (ECMA), shared the Army has created 178 integrated online systems in the last 10 years, 46 of which were established since 2020.
Throughout my career I’ve been asked several times by members of the ITOps teams, “Why end-user experience monitoring is critical”. If you take a customer focused monitoring approach you can figure out what the journey of this customer comes across, what the digital touchpoints are, and help solve their issues. Dynatrace news.
Real user monitoring can help you catch these issues before they impact the bottom line. What is real user monitoring? Real user monitoring (RUM) is a performance monitoring process that collects detailed data about a user’s interaction with an application. Real user monitoring collects data on a variety of metrics.
Infrastructure monitoring is the process of collecting critical data about your IT environment, including information about availability, performance and resource efficiency. Many organizations respond by adding a proliferation of infrastructure monitoring tools, which in many cases, just adds to the noise. Stage 2: Service monitoring.
Log monitoring, log analysis, and log analytics are more important than ever as organizations adopt more cloud-native technologies, containers, and microservices-based architectures. What is log monitoring? Log monitoring is a process by which developers and administrators continuously observe logs as they’re being recorded.
Observability platforms address the challenge of message queue monitoring by capturing and analyzing queue data. It automatically discovers and monitors message queues and uses AI to instantly identify issues and their impact on applications and user experience. Watch webinar now! The post What is a message queue?
This shift requires infrastructure monitoring to ensure all your components work together across applications, operating systems, storage, servers, virtualization, and more. What is infrastructure monitoring? . What to look for when selecting an infrastructure monitoring solution?
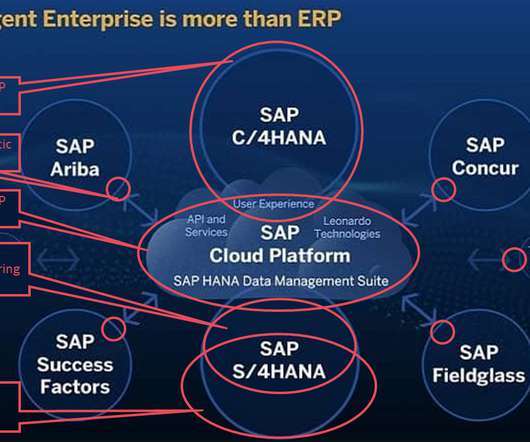
This means that you should ask the following: Does your monitoring solution work with SAP both on-premise and within cloud infrastructure ? Cover all your monitoring needs across your entire SAP product portfolio with Dynatrace. Monitor, analyze, and boost customer experience on SAP C/4HANA and SAP Cloud Platform.
Mobile app monitoring and mobile analytics make this possible. With the right monitoring solution, you can get ahead of problems to help increase overall app adoption and user satisfaction. What is mobile app monitoring? Mobile app monitoring is the process of collecting and analyzing data about application performance.
In the webinar “ Intelligent Kubernetes observability and automation ,” Dynatrace expert Henrik Rexed and GCP experts Gari Singh and Alisha Stull provide insights into leveraging AI-powered observability and automation to gain granular insights into Kubernetes environments on Google Cloud Platform at an enterprise scale.
For a deeper look into how to gain end-to-end observability into Kubernetes environments, tune into the on-demand webinar Harness the Power of Kubernetes Observability. Watch webinar now! Built-in monitoring. Needs third party tools for monitoring. Needs third party tools for monitoring. Kubernetes vs Docker Swarm.
Observability platforms address the challenge of message queue monitoring by capturing and analyzing queue data. It automatically discovers and monitors message queues and uses AI to instantly identify issues and their impact on applications and user experience. The importance of an observability platform approach.
Let me give you an overview of what was shown and let me answer questions we couldn’t answer during the webinar due to a technical glitch on the webinar platform! After every experiment run Akamas changes application, runtime, database or cloud configuration based on monitoring data it captured during the previous experiment run.
Recently, I had the opportunity to moderate a webinar, Using AIOps to focus I&O resources on what really matters , with guest speaker, Forrester Senior Analyst Rich Lane and Dynatrace SVP of product Steve Tack. In the webinar you spoke about the importance of connecting to business outcomes. Dynatrace news.
Comprehensive observability is also essential for digital experience monitoring (DEM). In response, many organizations add more monitoring tools , which adds to cloud complexity and slows down timely responses to issues. Watch webinar now! Watch webinar now! Why full-stack observability matters.
In a webinar session I had with Mitchells & Butlers , who are leading pub and restaurant brand in the UK (circa 1700 establishments), they shared how they continuously monitor and optimize user journeys and paths to conversion. You can watch the webinar here: Ready to open, Ready to order: UK Chain Talks Mobile App Ordering.
I recently hosted a webinar with guest speakers, Forrester Consultant Chris Layton and former Forrester Consultant Charlie Dorrier, to dive into the recent Forrester TEI Study in more detail. Many of our partner webinar attendees asked whether their prospects of smaller sizes would yield the same benefits? Watch webinar now!
In the recent webinar, Good to great: Case studies in excellence on state and local government transformations, Tammy Zbojniewicz, enterprise monitoring and service delivery owner within Michigan’s Department of Technology, Management, and Budget (DTMB), illustrates that meeting both objectives is possible.
In a recent webinar , Saif Gunja – director of DevOps product marketing at Dynatrace – sat down with three SRE panelists to discuss the standout findings and where they see the future of SRE. SREs need SLOs to measure and monitor performance, but many organizations lack the automation and intelligence to streamline data.
We came up with list of four key questions, then answered and demoed in our recent webinar. Four key questions for IT Operations we answered in our webinar! If you’re interested in the German version of the webinar feel free to watch it in our native tone??.
Get insights into Google BigQuery service metrics – Hub article This Dynatrace extension leverages data collected from the Google Operations API to constantly monitor health and performance of Google BigQuery services. Learn more. The post Google Cloud Next 2024: AI innovation for Google Cloud appeared first on Dynatrace news.
During a recent webinar , Dynatrace partners had the opportunity to learn how they deliver greater value to their customers while expanding their account footprints. For further insights on how Dynatrace partners can help their customers move from Managed to SaaS, and for a demo of the Migration Assistant, watch the webinar on-demand.
Every software development team grappling with Generative AI (GenAI) and LLM-based applications knows the challenge: how to observe, monitor, and secure production-level workloads at scale. Production performance monitoring: Service uptime, service health, CPU, GPU, memory, token usage, and real-time cost and performance metrics.
and scales up as monitoring environments grow by simply adding nodes, with built-in failover and automatic load balancing to ensure optimal resource usage. If you would like to learn more about Dynatrace and Microsoft, check out our webinar for a deep dive on how Dynatrace can modernize your Azure operations.
The adoption of cloud computing in the federal government will accelerate in a meaningful way over the next 12 to 18 months, increasing the importance of cloud monitoring. Obstacles to cloud monitoring. Being able to safely monitor the cloud will be paramount moving forward. Dynatrace news.
Although some people may think of observability as a buzzword for sophisticated application performance monitoring (APM) , there are a few key distinctions to keep in mind when comparing observability and monitoring. What is the difference between monitoring and observability? Is observability really monitoring by another name?
Security should be an integral part of each stage of the software delivery lifecycle, from development to monitoring in real time. Monitor the application before, during, and after migration Migrating and changing code can be a tricky business. Use SLAs, SLOs, and SLIs as performance benchmarks for newly migrated microservices.
Because all these resources generate huge amounts of data in various locations, it makes it difficult to monitor. These challenges make Azure observability critical for building and monitoring cloud-native applications. One of the key monitoring strategies in the Cloud Adoption Framework is observability.
Register to listen to the webinar. Therefore, it’s no surprise these priorities are among the top five released by NASCIO in the State CIO Top 10 Priorities for 2023.
Today, as part of an interview with a customer for an upcoming webinar, we noticed they had a problem detection with a number of dependencies analyzed that had to be seen to be believed. The post Davis is monitoring how many dependencies per problem? We will randomly select some submissions to receive custom Davis stickers and swag.
While logging is the act of recording logs, organizations extract actionable insights from these logs with log monitoring, log analytics, and log management. Comparing log monitoring, log analytics, and log management. Log monitoring enables the collection of log data, and log analysis promotes intelligent, data-driven decision making.
Modern cloud application security done right – on-demand webinar Watch our webinar about modern cloud application security done right. Observability is critical for monitoring application performance, infrastructure, and user behavior within hybrid, microservices-based environments.
This already indicates that a few weeks if not months easily pass until one has honed the system far enough to completely trust it with production monitoring of business-critical applications. Data sources typically include common infrastructure monitoring tools and second-generation APM solutions as well as other solutions.
Teams can no longer effectively manage and secure today’s multicloud environments using traditional monitoring tools. While conventional monitoring scans the environment using correlation and statistics, it provides little contextual information for remediating performance or security issues. Modern observability vs. monitoring.
This platform should also support automated release monitoring and validation, and correlate build, test, deployment, and operational data in context for rich analysis. The 4 Golden Signals Service Flow solution is one of two solutions focused on Google’s four golden signals of monitoring.
To gain better insight into these tasks, IT expanded their monitoring perspective to include key user journeys and their conversion goals, leveraging the discrete page-level metrics they were already collecting. Watch webinar now! The application supports two key business goals: bank transfers and currency exchanges.
Other strengths include microservices, transaction, and customer experience (CX) monitoring, and intelligent analytics. We also encourage you to sign up for the on-demand webinar series, AIOps with Dynatrace software intelligence , which describes and demonstrates how it all works.
In a recent webinar , Dynatrace DevOps activist Andi Grabner and senior software engineer Yarden Laifenfeld explored developer observability. With traditional monitoring tools, the granular data that developers require typically involves manual preparation. To watch the full webinar, check out the on-demand recording here.
How well do the IT departments for each of these companies monitor critical user journeys and business transactions? Based on my experience, here are my guesses: The airline IT team does not monitor user journeys. The rental car company monitors user journeys. Watch webinar now! BizOps maturity. Want to learn more?
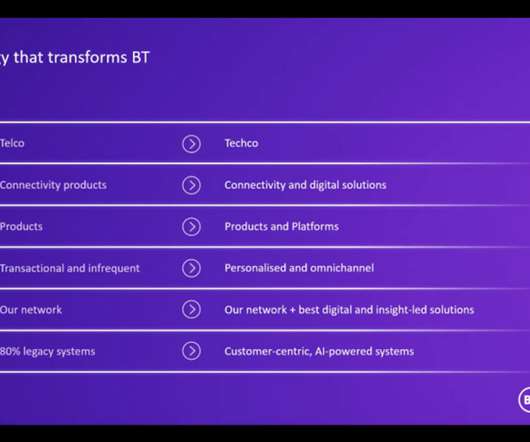
AIOps incorporated into BT’s digital transformation approach “has really transformed the way we work [and] the way the teams feel about their work,” said Chris Deane, head of digital platform and security engineering at BT, during a webinar on the company’s digital transformation. This is why AIOps is required more than ever.”.
Paul recently joined me on one of my Performance Clinics, which you can watch in our on-demand webinar library or stream it via YouTube, and he gave some eye-opening insights about how they run hackathons, ways to sell it to leadership & business and how it benefits their employees and improves culture. One of the teams at END.
We organize all of the trending information in your field so you don't have to. Join 5,000+ users and stay up to date on the latest articles your peers are reading.
You know about us, now we want to get to know you!
Let's personalize your content
Let's get even more personalized
We recognize your account from another site in our network, please click 'Send Email' below to continue with verifying your account and setting a password.


Let's personalize your content