This site uses cookies to improve your experience. To help us insure we adhere to various privacy regulations, please select your country/region of residence. If you do not select a country, we will assume you are from the United States. Select your Cookie Settings or view our Privacy Policy and Terms of Use.
Cookie Settings
Cookies and similar technologies are used on this website for proper function of the website, for tracking performance analytics and for marketing purposes. We and some of our third-party providers may use cookie data for various purposes. Please review the cookie settings below and choose your preference.
Used for the proper function of the website
Used for monitoring website traffic and interactions
Cookie Settings
Cookies and similar technologies are used on this website for proper function of the website, for tracking performance analytics and for marketing purposes. We and some of our third-party providers may use cookie data for various purposes. Please review the cookie settings below and choose your preference.
Strictly Necessary: Used for the proper function of the website
Performance/Analytics: Used for monitoring website traffic and interactions
We’re excited to share that Dynatrace has been recognized in the DevOps: Observability category of InfoWorlds 2024 Technology of the Year awards! In todays digital landscape, organizations face intricate challenges that demand more than basic monitoring. Register now !
We’re excited to announce that Dynatrace has been named a Leader in the inaugural 2024 Gartner® Magic Quadrant™ for Digital Experience Monitoring. Dynatrace digital experience monitoring (DEM) monitors and analyzes the quality of digital experiences for users across digital channels by collecting data from multiple sources.
With so many types of technologies in software stacks around the globe, OpenTelemetry has emerged as the de facto standard for gathering telemetry data. Profiling Profiling has always been a crucial aspect of performance monitoring, and its great to see OpenTelemetry catching up. OpenTelemetry trends are following suit.
On average, organizations use 10 different tools to monitor applications, infrastructure, and user experiences across these environments. Indeed, around 85% of technology leaders believe their problems are compounded by the number of tools, platforms, dashboards, and applications they rely on to manage multicloud environments.
The rapid evolution of cloud technology continues to shape how businesses operate and compete. AWS’ recent recognition of Dynatrace as the 2024 AWS EMEA Technology Partner of the Year highlights the joint commitment to accelerate customer cloud transformation.
We’re proud to announce that Ally Financial has presented Dynatrace with its Ally Technology Velocity with Quality award. This is the second time Ally Financial has presented its Ally Technology Partner Awards. They quickly adopted full-stack monitoring and real user monitoring (RUM).
Part 2: The second volume deals with how to assist in controlling the diffusion of sensitive network information as it targets advanced techniques for actively monitoring the network at the present time.
As organizations adopt more cloud-native technologies, the risk—and consequences—of cyberattacks are also increasing. Through this integration, Dynatrace enriches data collected by Microsoft Sentinel to provide organizations with enhanced data insights in context of their full technology stack. Runtime application protection.
Docker, the main containerization technology, has transformed application packaging and deployment. While Docker makes it easier to execute apps, it is also critical to monitor and log your Dockerized environments to ensure they are working properly and stay safe.
Their technology provides expert-level recommendations for SQL statements, vector search queries, indices, and database schemas, along with automated remediation actions. For SREs, this means better proactive monitoring, fewer database-related incidents, and greater stability in production environments.
Docker Swarm is a popular container orchestration technology that makes containerized application administration easier. While Docker Swarm provides strong capabilities for deploying and scaling applications, it’s also critical to monitor and report the performance and health of your Swarm clusters.
A cornerstone of Dynatrace monitoring capabilities, OneAgent boosts your log ingestion experience by automatically detecting and tagging logs based on the detected process technologyeven for custom-developed applications. Technology processor bundles increase the readability of parsed logs. Configuration is fully customizable.
Cloud-native technologies are driving the need for organizations to adopt a more sophisticated IT monitoring approach to satisfy the competitive demands of modern business. As a result, organizations need to shift toward more sophisticated models of monitoring and managing IT operations. Operational optimization.
In the dynamic world of cloud-native technologies, monitoring and observability have become indispensable. However, managing its health and performance efficiently necessitates a robust monitoring solution. Kubernetes, the de-facto orchestration platform, offers scalability and agility.
Current synthetic capabilities Dynatrace Synthetic Monitoring is a powerful tool that provides insight into the health of your applications around the clock and as they’re perceived by your end users worldwide. Compared to other solutions I have tested, Dynatrace NAM monitors are the most configurable which is to my liking.
already address SNMP, WMI, SQL databases, and Prometheus technologies, serving the monitoring needs of hundreds of Dynatrace customers. JMX monitoring extensions are currently being migrated. are technologically very different, Python and JMX extensions designed for Extension Framework 1.0 Extensions 2.0 Extensions 2.0
Monitoring business processes is one thing organizations can do to help improve the key business processes that enable them to provide great customer experiences. Business process monitoring refers to continuously tracking and analyzing key performance indicators (KPIs) from relevant process milestones.
You’ll see how a clear line of sight across your entire technology stack can be transformative and learn how to apply these lessons to your own business. BT, the UK’s largest mobile and fixed broadband provider, faced this challenge when managing multiple monitoring tools across different teams.
Dynatrace OpenPipeline is a new stream processing technology that ingests and contextualizes data from any source. Business process monitoring and optimization. Want to see how we use business events from log files to support business process monitoring? Business event ingestion and analysis with log files.
An hourly rate for Infrastructure Monitoring The Dynatrace Platform Subscription (DPS) offers a flat rate for Infrastructure Monitoring , providing observability for cloud platforms, containers, networks, and data center technologies with no limits on host memory and with AIOps included.
FinOps , short for Financial Operations, is a methodology combining finance, technology, and business teams to optimize cloud spending and maximize value in cloud environments. This granular level of transparency helps identify cost drivers, monitor usage patterns, and uncover opportunities for cost savings.
With the world’s increased reliance on digital services and the organizational pressure on IT teams to innovate faster, the need for DevOps monitoring tools has grown exponentially. But when and how does DevOps monitoring fit into the process? And how do DevOps monitoring tools help teams achieve DevOps efficiency?
This massive migration is critical to organizations’ digital transformation , placing cloud technology front and center and elevating the need for greater visibility, efficiency, and scalability delivered by a unified observability and security platform. Thoughtful reinvestment. Interested in learning more?
Recently, I had the pleasure of speaking with Tiernan Ray for The Technology Letter ( subscribers can read here ) , where we discussed how observability is transforming and how Dynatrace is navigating industry changes.I Observability is no longer just for IT Ops Observability is no longer just about monitoring IT systems.
With over 700 ready-made apps and integrations on the Hub, Dynatrace seamlessly automates full stack monitoring, ensuring comprehensive coverage regardless of the technologies you’re utilizing. Search the Hub to find Extensions for effortlessly importing technology-specific metrics. Of course, seeing is believing.
As the world becomes increasingly interconnected with the proliferation of IoT devices and a surge in applications, digital transactions, and data creation, mobile monitoring — monitoring mobile applications — grows ever more critical.
For cloud operations teams, network performance monitoring is central in ensuring application and infrastructure performance. Network performance monitoring core to observability For these reasons, network activity becomes a key data source in IT observability. But this approach merely perpetuates data silos and cloud complexity.
In the recently published Gartner® “ Critic al Capabilities for Application Performance Monitoring and Observability,” Dynatrace scored highest for the IT Operations Use Case (4.15/5) This is accomplished by using service monitoring and anomaly detection for early-warning notifications of performance issues.” 5) in the Gartner report.
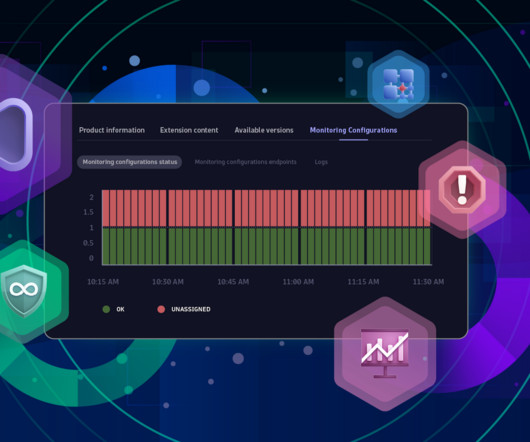
Thousands of new technologies are created and integrated with Dynatrace products every day. Introducing Dynatrace Extensions In short, the Extensions app is the central place for configuring, monitoring, and discovering extensions. You can call upon it to fill any monitoring gaps. Dynatrace already offers the Extensions 2.0
The Texas Risk and Authorization Management Program (TX-RAMP) provides a standardized approach for security assessment, certification, and continuous monitoring of cloud computing services that process the data of Texas state agencies. What is TX-RAMP?
With this, traditional monitoring tools are struggling to keep up as IT systems grow more complex with microservices, dynamic setups, and distributed networks. When it comes to customer satisfaction, providing excellent service isnt optional anymore its essential for success.
Real-time monitoring : The periodic reports from cloud service providers lack real-time monitoring and actionable insights, limiting IT teams’ ability to make immediate adjustments to reduce carbon footprints. If you’re doing one of these you’re amplifying the other.
The growing need for observability in digital transformation Digital transformation and the ubiquitous adoption of multicloud and cloud-native technologies have made observability mandatory. Additionally, we’ve been able to unify dev teams and business teams to set and monitor metrics around user interaction with our sites.”
In the 2023 Magic Quadrant for Application Performance Monitoring (APM) and Observability, Gartner has named Dynatrace a Leader and positioned it highest for Ability to Execute and furthest for Completeness of Vision. Although implementations are nascent, the security capabilities of APM and observability tools have proved to be valuable.
Dynatrace OneAgent ® discovers, observes, and protects access to OpenAI automatically, with no manual configuration, revealing the full context of used technologies, service interaction topology, security-vulnerability analysis, and the observability of all metrics, traces, logs, and business events in real time.
While these frameworks use a declarative syntax to simplify the codebase and expedite development lifecycles, they also introduce new challenges in monitoring the user experience of mobile apps. A key aspect of observability is the monitoring agent that a mobile app is instrumented with.
If cloud-native technologies and containers are on your radar, you’ve likely encountered Docker and Kubernetes and might be wondering how they relate to each other. In a nutshell, they are complementary and, in part, overlapping technologies to create, manage, and operate containers. Built-in monitoring. Dynatrace news.
Dynatrace with Red Hat OpenShift monitoring stands out for the following reasons: With infrastructure health monitoring and optimization, you can assess the status of your infrastructure at a glance to understand resource consumption and thus optimize resource allocation for cost efficiency.
The goal of observability is to understand what’s happening across all these environments and among the technologies, so you can detect and resolve issues to keep your systems efficient and reliable and your customers happy. What is the difference between monitoring and observability? In short, no.
In todays data-driven world, the ability to effectively monitor and manage data is of paramount importance. With its widespread use in modern application architectures, understanding the ins and outs of Redis monitoring is essential for any tech professional. Redis, a powerful in-memory data store, is no exception.
AWS Lambda is the fastest growing technology for serverless workloads and helps developers innovate faster. It’s critical that you understand how they impact your customer-facing web applications, mobile apps, or APIs and how they interact with other functions, services, and classic technology stacks. Dynatrace news.
However, the 2024 State of Observability report from Dynatrace reveals that the explosion of data generated by these complex ecosystems is pushing traditional monitoring and analytics approaches to their limits.
Dynatrace does this by automatically creating a dependency map of your IT ecosystem, pinpointing the technologies in your stack and how they interact with each other, including servers, processes, application services, and web applications across data centers and multicloud environments. Q: Do we help with our customers’ entire environments?
We organize all of the trending information in your field so you don't have to. Join 5,000+ users and stay up to date on the latest articles your peers are reading.
You know about us, now we want to get to know you!
Let's personalize your content
Let's get even more personalized
We recognize your account from another site in our network, please click 'Send Email' below to continue with verifying your account and setting a password.


Let's personalize your content