This site uses cookies to improve your experience. To help us insure we adhere to various privacy regulations, please select your country/region of residence. If you do not select a country, we will assume you are from the United States. Select your Cookie Settings or view our Privacy Policy and Terms of Use.
Cookie Settings
Cookies and similar technologies are used on this website for proper function of the website, for tracking performance analytics and for marketing purposes. We and some of our third-party providers may use cookie data for various purposes. Please review the cookie settings below and choose your preference.
Used for the proper function of the website
Used for monitoring website traffic and interactions
Cookie Settings
Cookies and similar technologies are used on this website for proper function of the website, for tracking performance analytics and for marketing purposes. We and some of our third-party providers may use cookie data for various purposes. Please review the cookie settings below and choose your preference.
Strictly Necessary: Used for the proper function of the website
Performance/Analytics: Used for monitoring website traffic and interactions
OpenTelemetry is enhancing GenAI observability : By defining semantic conventions for GenAI and implementing Python-based instrumentation for OpenAI, OpenTel is moving towards addressing GenAI monitoring and performance tuning needs. The Collector is expected to be ready for prime time in 2025, reaching the v1.0
For SREs, this means better proactive monitoring, fewer database-related incidents, and greater stability in production environments. A shared vision At Dynatrace, weve built a comprehensive observability platform that already includes deep database visibility, the Top Database Statements view, and Grail for unified data storage and analysis.
By ensuring that all processes—from data collection to storage and usage—comply with regulatory requirements, organizations can better manage potential threats. Retention periods and access controls must be properly configured to protect such PII.
In fact, according to a Dynatrace global survey of 1,300 CIOs , 99% of enterprises utilize a multicloud environment and seven cloud monitoring solutions on average. What is cloud monitoring? Cloud monitoring is a set of solutions and practices used to observe, measure, analyze, and manage the health of cloud-based IT infrastructure.
Using existing storage resources optimally is key to being able to capture the right data over time. Increased storage space availability. The compression of transaction data older than three days can free up to 50% more storage space in your Dynatrace Managed Cluster. Data compression is completed on June 12.
Business process monitoring and optimization. Monitor and optimize business processes with real-time visibility into process KPIs and detailed analytics for each step to improve customer satisfaction, increase operational efficiency, and reduce cost. Reduced storage and query overhead for business use cases.
Dynatrace OneAgent is great for monitoring the full stack. There are certain situations when an agent based approach isn’t possible, such as with network or storage devices, or a very old OS. While this will give you a lot of information about the health of these components, sometimes a simple synthetic monitor is sufficient.
Real-time monitoring : The periodic reports from cloud service providers lack real-time monitoring and actionable insights, limiting IT teams’ ability to make immediate adjustments to reduce carbon footprints. Storage calculations assume that one terabyte consumes 1.2
Monitoring Kubernetes is an important aspect of Day 2 o perations and is often perceived as a significant challenge. That’s another example where monitoring is of tremendous help as it provides the current resource consumption picture and help to continuously fine tune those settings. . Monitoring in the Kubernetes world .
With the world’s increased reliance on digital services and the organizational pressure on IT teams to innovate faster, the need for DevOps monitoring tools has grown exponentially. But when and how does DevOps monitoring fit into the process? And how do DevOps monitoring tools help teams achieve DevOps efficiency?
Message brokers handle validation, routing, storage, and delivery, ensuring efficient and reliable communication. RabbitMQ can be deployed in distributed environments and includes monitoring tools through a built-in dashboard and CLI. This ensures that storage is used efficiently and only active messages remain in the queue.
Log monitoring, log analysis, and log analytics are more important than ever as organizations adopt more cloud-native technologies, containers, and microservices-based architectures. What is log monitoring? Log monitoring is a process by which developers and administrators continuously observe logs as they’re being recorded.
IT infrastructure is the heart of your digital business and connects every area – physical and virtual servers, storage, databases, networks, cloud services. This shift requires infrastructure monitoring to ensure all your components work together across applications, operating systems, storage, servers, virtualization, and more.
These resources generate vast amounts of data in various locations, including containers, which can be virtual and ephemeral, thus more difficult to monitor. These challenges make AWS observability a key practice for building and monitoring cloud-native applications. AWS monitoring best practices. What is AWS observability?
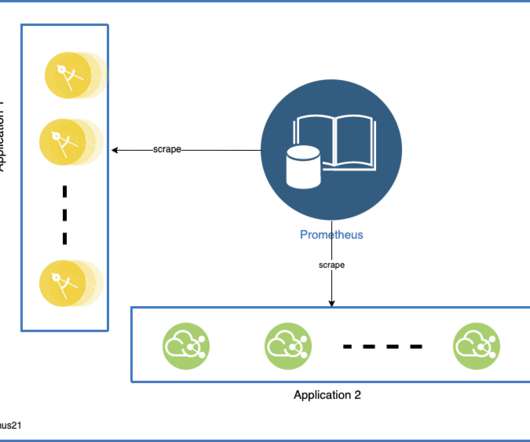
Prometheus is an open-source system monitoring and alerting toolkit. Data related to monitoring is stored in RAM and LevelDB nevertheless data can be stored to other storage systems such as ElasticSearch, InfluxDb, and others, [link]. Watch out for your self-destructing apps!
Dynatrace Digital Experience Monitoring , as part of the Dynatrace Software Intelligence Platform, connects front-end monitoring and the outside-in user perspective with application performance to understand the impact of performance issues across your full stack on user experience and business outcomes. Virginia (Azure), N.
Digital experience monitoring (DEM) allows an organization to optimize customer experiences by taking into account the context surrounding digital experience metrics. What is digital experience monitoring? Primary digital experience monitoring tools.
In the recently published Gartner® “ Critic al Capabilities for Application Performance Monitoring and Observability,” Dynatrace scored highest for the IT Operations Use Case (4.15/5) This is accomplished by using service monitoring and anomaly detection for early-warning notifications of performance issues.” 5) in the Gartner report.
Prometheus is an open-source monitoring and alerting toolkit for services and applications that run in containers. Prometheus components include client libraries for application code instrumentation, special-purpose exporters for popular services, and the optional Prometheus server for orchestrating service discovery and data storage.
For cloud operations teams, network performance monitoring is central in ensuring application and infrastructure performance. Network performance monitoring core to observability For these reasons, network activity becomes a key data source in IT observability. But this approach merely perpetuates data silos and cloud complexity.
And that includes infrastructure monitoring. With all this change, thinking about infrastructure monitoring in the same way as you did before is a big mistake. For today’s dynamic, hybrid, multi-cloud environments, infrastructure monitoring must be: Automatic and easy. Able to provide answers, not just data. Automatic and easy.
Option 1: Log Processing Log processing offers a straightforward solution for monitoring and analyzing title launches. Additionally, the time-sensitive nature of these investigations precludes the use of cold storage, which cannot meet the stringent SLAs required.
For executives, these directives present several challenges, including compliance complexity, resource allocation for continuous monitoring, and incident reporting. The Federal Reserve Regulation HH in the United States focuses on operational resilience requirements for systemically important financial market utilities.
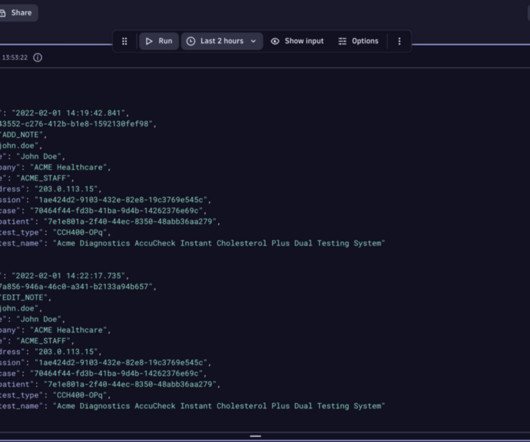
With the release of Dynatrace 1.175, we’ve improved the content validation capabilities of synthetic browser and clickpath monitors. This change has the potential to cause existing synthetic browser and clickpath monitors to fail. What do I need to do if my monitor fails? Credential storage. What’s next.
On a small scale, this isn’t problematic but when dealing with large-scale deployments, organizations end up using lots of computing, storage, and human resources just to manage their indexes. As the database grows in size, so does the index management cost.
With the release of Dynatrace 1.178, we’ve added a new type of content validation capability for synthetic browser and clickpath monitors. Credential storage. The post Improved content validation for Synthetic browser and clickpath monitors appeared first on Dynatrace blog. Dynatrace news. Additional public locations.
Implement proactive monitoring for each of these endpoints. Key Features Proactive monitoring through scheduled collectors jobs Our Title Health microservice runs a scheduled collector job every 30 minutes for most of our personalization stack. Track real-time title impressions from the NetflixUI. there is a dedicated collector.
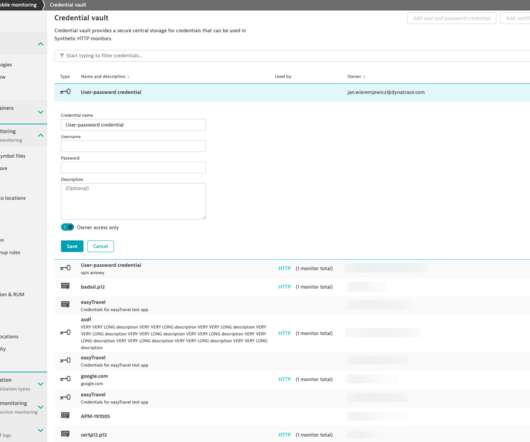
With Dynatrace Synthetic Monitoring, you can easily monitor the availability and performance of your applications as experienced by your customers around the world and around the clock. Safely store your credentials in a central place, automatically update monitors, and more! Easily rotate passwords.
Use Cases and Requirements At Netflix, our counting use cases include tracking millions of user interactions, monitoring how often specific features or experiences are shown to users, and counting multiple facets of data during A/B test experiments , among others. Let’s take a closer look at the structure and functionality of the API.
Unlike full backups that duplicate everything, incremental backups store only changes since the last save, reducing storage needs and speeding up recovery. Key Benefits: Smaller Storage Footprint: Saves only modified data, cutting down backup size. What are the security and monitoring improvements in PostgreSQL 17?
The credential vault is an invaluable enhancement to Dynatrace Synthetic Monitoring , especially as more and more websites, applications, and API endpoints are protected with authentication/authorization solutions. So we decided to make it easier for administrators to manage monitors and credentials in several ways—read on below.
Consumers store messages in a queue — usually in a buffer or on a storage medium — until they can process and delete them. Observability platforms address the challenge of message queue monitoring by capturing and analyzing queue data. How an observability platform eases message queue monitoring appeared first on Dynatrace blog.
Consumers store messages in a queue — usually in a buffer or on a storage medium — until they can process and delete them. Observability platforms address the challenge of message queue monitoring by capturing and analyzing queue data. How an observability platform eases message queue monitoring appeared first on Dynatrace blog.
When using Dynatrace OneAgent ® , captured data doesn’t leave the monitored environment. Masking at storage: Data is persistently masked upon ingestion into Dynatrace. Leverage three masking layers Masking at capture and masking at storage operations exclude targeted sensitive data points.
A distributed storage system is foundational in today’s data-driven landscape, ensuring data spread over multiple servers is reliable, accessible, and manageable. Understanding distributed storage is imperative as data volumes and the need for robust storage solutions rise.
An AI observability strategy—which monitors IT system performance and costs—may help organizations achieve that balance. AI requires more compute and storage. Training AI data is resource-intensive and costly, again, because of increased computational and storage requirements. Continuously monitor AI models’ performance.
Log analytics is useful for application performance monitoring in cloud, virtualized, and physical environments, including Kubernetes workloads, application security, and business analytics. Unfortunately, many organizations have dozens of siloed data collection and monitoring tools and teams. Cold storage and rehydration.
Log analytics is useful for application performance monitoring in cloud, virtualized, and physical environments, including Kubernetes workloads, application security, and business analytics. Unfortunately, many organizations have dozens of siloed data collection and monitoring tools and teams. Cold storage and rehydration.
Secondly, determining the correct allocation of resources (CPU, memory, storage) to each virtual machine to ensure optimal performance without over-provisioning can be difficult. Start monitoring Hyper-V Navigate to the Dynatrace Hub and activate the Microsoft Hyper-V Extension. What’s next?
Highlighting NewReleases For new content, impression history helps us monitor initial user interactions and adjust our merchandising efforts accordingly. The enriched data is seamlessly accessible for both real-time applications via Kafka and historical analysis through storage in an Apache Iceberg table.
Log management is an organization’s rules and policies for managing and enabling the creation, transmission, analysis, storage, and other tasks related to IT systems’ and applications’ log data. Comparing log monitoring, log analytics, and log management. Log management brings together log monitoring and log analysis.
Taking a proactive and efficient approach to Kubernetes cluster monitoring can help engineering teams identify and predict many critical problems like CPU outage, memory outage, storage issues well in advance of these issues taking a toll on a business.
In addition to automatic full-stack monitoring, Dynatrace provides comprehensive support for all AWS services that publish metrics to Amazon CloudWatch, providing advanced observability for dynamic hybrid clouds. Dynatrace now monitors your AWS Outposts environment just like any AWS cloud Region. What is AWS Outposts? Next steps.
While Atlas is architected around compute & storage separation, and we could theoretically just scale the query layer to meet the increased query demand, every query, regardless of its type, has a data component that needs to be pushed down to the storage layer.
We organize all of the trending information in your field so you don't have to. Join 5,000+ users and stay up to date on the latest articles your peers are reading.
You know about us, now we want to get to know you!
Let's personalize your content
Let's get even more personalized
We recognize your account from another site in our network, please click 'Send Email' below to continue with verifying your account and setting a password.


Let's personalize your content