This site uses cookies to improve your experience. To help us insure we adhere to various privacy regulations, please select your country/region of residence. If you do not select a country, we will assume you are from the United States. Select your Cookie Settings or view our Privacy Policy and Terms of Use.
Cookie Settings
Cookies and similar technologies are used on this website for proper function of the website, for tracking performance analytics and for marketing purposes. We and some of our third-party providers may use cookie data for various purposes. Please review the cookie settings below and choose your preference.
Used for the proper function of the website
Used for monitoring website traffic and interactions
Cookie Settings
Cookies and similar technologies are used on this website for proper function of the website, for tracking performance analytics and for marketing purposes. We and some of our third-party providers may use cookie data for various purposes. Please review the cookie settings below and choose your preference.
Strictly Necessary: Used for the proper function of the website
Performance/Analytics: Used for monitoring website traffic and interactions
Still, while DevOps practices enable developer agility and speed as well as better code quality, they can also introduce complexity and data silos. At Dynatrace Perform, the annual software intelligence platform conference, we will highlight new integrations that eliminate toolchain silos, tame complexity, and automate DevOps practices.
Dynatrace Synthetic Monitoring allows you to proactively monitor the availability of your public as well as your internal web applications and API endpoints from locations around the globe or important internal locations such as branch offices. Synthetic monitors help you find issues before they affect your customers.
Dynatrace container monitoring supports customers as they collect metrics, traces, logs, and other observability-enabled data to improve the health and performance of containerized applications. The containers can run anywhere, whether a private data center, the public cloud or a developer’s own computing devices.
Gaining knowledge about IBM i performance can be a challenging and pricey task. Additionally, certain tools require auxiliary services to gather performance data before it can be examined and queried. It then collects performance data using existing database services running on your system. It’s all monitored remotely !
Digital experience monitoring (DEM) is crucial for organizations to meet this demand and succeed in today’s competitive digital economy. DEM solutions monitor and analyze the quality of digital experiences for users across digital channels. The time taken to complete the page load.
In the recently published Gartner® “ Critic al Capabilities for Application PerformanceMonitoring and Observability,” Dynatrace scored highest for the IT Operations Use Case (4.15/5) This is accomplished by using service monitoring and anomaly detection for early-warning notifications of performance issues.” out of 5.00.
Cloud-native technologies are driving the need for organizations to adopt a more sophisticated IT monitoring approach to satisfy the competitive demands of modern business. As a result, organizations need to shift toward more sophisticated models of monitoring and managing IT operations. Operational optimization. Resource optimization.
Speed, UX, availability, and frequency of updates are increasingly important with mobile apps. The responsibility of developers keeps growing, and as mobile apps get more complex, new tools for mobile performancemonitoring and testing are being born. Consumers and enterprises alike expect more from software.
They now use modern observability to monitor expanding cloud environments in order to operate more efficiently, innovate faster and more securely, and to deliver consistently better business results. These are just some of the topics being showcased at Perform 2023 in Las Vegas. We’ll post news here as it happens! Learn more.
With today’s high expectations for the speed and availability of applications, you need a deep understanding of real user experiences to make the best business decisions. Dynatrace Synthetic Monitoring ensures that your application is available and performs well from anywhere in the world to meet your SLAs.
Echoing John Van Siclen’s sentiments from his Perform 2020 keynote, Steve cited Dynatrace customers as the inspiration and driving force for these innovations. “A Highlighting the company’s announcements from Perform 2020, Steve and a team of other Dynatrace product leaders introduced the audience to several of our latest innovations.
With the world’s increased reliance on digital services and the organizational pressure on IT teams to innovate faster, the need for DevOps monitoring tools has grown exponentially. But when and how does DevOps monitoring fit into the process? And how do DevOps monitoring tools help teams achieve DevOps efficiency?
As businesses compete for customer loyalty, it’s critical to understand the difference between real-user monitoring and synthetic user monitoring. These development and testing practices ensure the performance of critical applications and resources to deliver loyalty-building user experiences. What is real user monitoring?
Web Performance is not only about understanding what makes a site fast. Performance is a feature and needs to be prioritized as such. Performance is a topic that has interested me for a long time. Moving over to web, the performance problems are different. This is not a post explaining why web performance is important.
As companies strive to innovate and deliver faster, modern software architecture is evolving at near the speed of light. This gives you deep visibility into your code running in Azure Functions, and, as a result, an understanding of its impact on overall application performance and user experience. Dynatrace news.
Kubernetes was architected to allow for additional technologies and services to assist in speed, scalability and reducing the overall complexity which can arise from a Microservices environment. Let’s go into a bit of detail on each pillar and the extended Observability Dynatrace provides: Metrics: Cluster health and utilization monitoring.
Benefits of quality gates Quality gates provide several advantages to organizations, including the following: Optimized software performance : Quality gates assess code at different SDLC stages and ensure that only high-quality code progresses. Several tools can be used to collect metrics in load/performance testing.
Log monitoring, log analysis, and log analytics are more important than ever as organizations adopt more cloud-native technologies, containers, and microservices-based architectures. What is log monitoring? Log monitoring is a process by which developers and administrators continuously observe logs as they’re being recorded.
While MySQL is known for its reliability and ease of use, ensuring top-notch performance is crucial. One way to do that is through performancemonitoring, an essential practice for identifying bottlenecks, maintaining optimal speed, and guaranteeing a seamless user experience.
However, if you’re an operations engineer who’s been tasked with migrating to HANA from a legacy database system, you’ll need to get up to speed quickly. Don’t worry, when it comes to SAP monitoring, Dynatrace has you covered. Simplify SAP HANA performancemonitoring and analysis.
Real user monitoring can help you catch these issues before they impact the bottom line. What is real user monitoring? Real user monitoring (RUM) is a performancemonitoring process that collects detailed data about a user’s interaction with an application. How real user monitoring works.
This blog post focuses on pipeline observability as a method for monitoring the software delivery capabilities of an organization’s IDP. Automate delivery processes: Ideally, an improvement entails introducing automation to eliminate manual tasks, foster collaboration, or speed up processes.
Infrastructure monitoring is the process of collecting critical data about your IT environment, including information about availability, performance and resource efficiency. Many organizations respond by adding a proliferation of infrastructure monitoring tools, which in many cases, just adds to the noise. Dynatrace news.
Mobile applications (apps) are an increasingly important channel for reaching customers, but the distributed nature of mobile app platforms and delivery networks can cause performance problems that leave users frustrated, or worse, turning to competitors. What is mobile app performance? Some of the most important KPIs are listed below.
In the fourteen years that I've been working in the web performance industry, I've done a LOT of research, writing, and speaking about the psychology of page speed – in other words, why we crave fast, seamless online experiences. In fairness, that was in the early 2000s, and site speed was barely on anyone's radar.
As organizations develop more applications and microservices, they are discovering they also need to run more performance tests in the same amount of time or less to meet service-level objectives (SLOs) that fulfill service-level agreements (SLAs). Current challenges with performance testing.
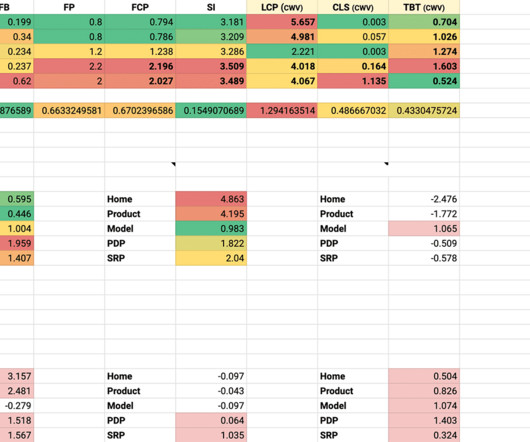
This is an update to my 2020 article Site-Speed Topography. Around two and a half years ago, I debuted my Site-Speed Topography technique for getting broad view of an entire site’s performance from just a handful of key URLs and some readily available metrics. What Is Site-Speed Topography? Optimise the work not done.
This is why we’re proud to announce fully automated and AI-powered full-stack monitoring for OpenShift 4.0 Traditional monitoring systems cannot keep up with the speed of change in those highly dynamic large-scale container environments. Automated distributed tracing, deep monitoring and AI-powered answers for OpenShift 4.0
Our goal is to speed up development and minimize rollbacks. Do Not Wait With Checks Teams aim to maintain continuous database reliability, focusing on ensuring their designs perform well in production, scale effectively, and allow for safe code deployments. Ensuring database reliability can be difficult. Lets explore how.
RISELabs , those wonderfully innovative folks over at Berkeley, have uplifted their Anna datatabase —a shared-nothing, thread-per-core architecture to achieve lightning-fast speeds by avoiding all coordination mechanisms—to become cloud-aware. Our monitoring engine automatically moves data between tiers based on access patterns.
In a distributed processing environment, message queuing is similar, although the speed and volume of messages are much greater. It provides a consistent platform that integrates with a variety of message queuing types to enable consistent performance regardless of the platform. Queued messages are typically small and specific.
— Excerpt from How Garbage Collection works in the Dynatrace Performance eBook) . However, garbage collection is one of the main sources of performance and scalability issues in any modern Java application. Any significant reduction in allocations will inevitably speed up your code. Speed up application code itself.
In a distributed processing environment, message queuing is similar, although the speed and volume of messages are much greater. It provides a consistent platform that integrates with a variety of message queuing types to enable consistent performance regardless of the platform. Queued messages are typically small and specific.
These are the goals of AI observability and data observability, a key theme at Dynatrace Perform 2024 , the observability provider’s annual conference, which takes place in Las Vegas from January 29 to February 1, 2024. Join us at Dynatrace Perform 2024 , either on-site or virtuall y, to explore these themes further.
The team can “catch more bugs and performance problems before the code is deployed to the production environment,” Smith said. State agencies measurably reduce outage severity and costs In the event of a performance problem, observability can reduce MTTR. Dynatrace truly helps us do more with less.
Mobile app monitoring and mobile analytics make this possible. With the right monitoring solution, you can get ahead of problems to help increase overall app adoption and user satisfaction. What is mobile app monitoring? Mobile app monitoring is the process of collecting and analyzing data about application performance.
Monitoring with ?the Readers who share our privacy concerns, please note, all the data we monitor is publicly available. . The insights in this b log rely heavily on data captured by Dynatrace’s proactive synthetic monitoring capabilities. Breaking d own performance across U.S. We ’ve also been monitoring U.
New technologies like Xamarin or React Native are accelerating the speed at which organizations release new features and unlock market reach. And when every team has its own monitoring requirements, you can easily end up with up to 10 different monitoring solutions. Optimize mobile app performance and maximize business impact.
I am delighted to share, Dynatrace has been named a Leader for the 11 th consecutive time in the 2021 Gartner Magic Quadrant for Application PerformanceMonitoring (APM) report. Dynatrace enables our customers to tame cloud complexity, speed innovation, and deliver better business outcomes through BizDevSecOps collaboration.
I never thought I’d write an article in defence of DOMContentLoaded , but here it is… For many, many years now, performance engineers have been making a concerted effort to move away from technical metrics such as Load , and toward more user-facing, UX metrics such as Speed Index or Largest Contentful Paint. Or are they…? That’s late!
Managing cloud performance is increasingly challenging for organizations that spread workloads across a greater variety of platforms. Moreover, organizations have to balance maintaining security, retaining cloud management expertise, and managing infrastructure performance. Rural lifestyle retail giant Tractor Supply Co.
At our virtual conference, Dynatrace Perform 2022 , the theme is “Empowering the game changers.”. Empowering the game changers at Dynatrace Perform 2022. Teams can no longer effectively manage and secure today’s multicloud environments using traditional monitoring tools. Modern observability vs. monitoring.
Over the years, I have watched and written about online retail and e-commerce IT performance. Below is a Dynatrace honeycomb chart depicting the performance of the synthetics tests tracked by the Dynatrace Business Insights team. This had the effect of dramatically speeding up its performance and reducing support costs.
Provide self-service platform services with dedicated UI for development teams to improve developer experience and increase speed of delivery. It enables the execution of configuration actions based on observability insights, such as resource consumption and performance management across all clusters.
We organize all of the trending information in your field so you don't have to. Join 5,000+ users and stay up to date on the latest articles your peers are reading.
You know about us, now we want to get to know you!
Let's personalize your content
Let's get even more personalized
We recognize your account from another site in our network, please click 'Send Email' below to continue with verifying your account and setting a password.


Let's personalize your content