This site uses cookies to improve your experience. To help us insure we adhere to various privacy regulations, please select your country/region of residence. If you do not select a country, we will assume you are from the United States. Select your Cookie Settings or view our Privacy Policy and Terms of Use.
Cookie Settings
Cookies and similar technologies are used on this website for proper function of the website, for tracking performance analytics and for marketing purposes. We and some of our third-party providers may use cookie data for various purposes. Please review the cookie settings below and choose your preference.
Used for the proper function of the website
Used for monitoring website traffic and interactions
Cookie Settings
Cookies and similar technologies are used on this website for proper function of the website, for tracking performance analytics and for marketing purposes. We and some of our third-party providers may use cookie data for various purposes. Please review the cookie settings below and choose your preference.
Strictly Necessary: Used for the proper function of the website
Performance/Analytics: Used for monitoring website traffic and interactions
Over the years, I have watched and written about online retail and e-commerce IT performance. What I have seen is a maturing of the online retail channels when it comes to delivering customer experiences. This year we saw few, if any, major issues with online retailers.
This is typically the first thing that comes to mind for IT professionals working in the retail industry when evaluating holiday readiness. CEOs of hybrid retailers prioritize e-commerce growth over in-store shopping, investing heavily in their online storefronts. That lesson remains important. Multi-channel logistics.
A business process is a collection of related, usually structured tasks or steps, performed in sequence, that achieve a defined business goal. Monitoring business processes is one thing organizations can do to help improve the key business processes that enable them to provide great customer experiences.
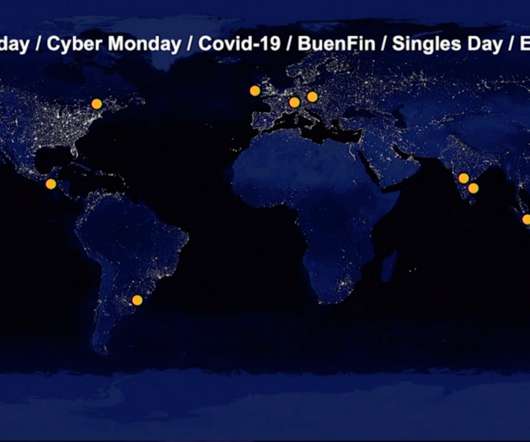
Over the last two month s, w e’ve monito red key sites and applications across industries that have been receiving surges in traffic , including government, health insurance, retail, banking, and media. Monitoring with ?the Breaking d own performance across U.S. We ’ve also been monitoring U.
Cloud-native technologies are driving the need for organizations to adopt a more sophisticated IT monitoring approach to satisfy the competitive demands of modern business. As a result, organizations need to shift toward more sophisticated models of monitoring and managing IT operations. Operational optimization. Resource optimization.
Real user monitoring can help you catch these issues before they impact the bottom line. What is real user monitoring? Real user monitoring (RUM) is a performancemonitoring process that collects detailed data about a user’s interaction with an application. How real user monitoring works.
Managing cloud performance is increasingly challenging for organizations that spread workloads across a greater variety of platforms. Moreover, organizations have to balance maintaining security, retaining cloud management expertise, and managing infrastructure performance. Rural lifestyle retail giant Tractor Supply Co.
These environments are marked by continuous delivery of microservice updates into production, the abstractions inherent in Kubernetes environments, and challenges associated with applications distributed across multicloud environments—often with performance and security risks. Dynatrace was recognized as Compuware from 2010-2014.
From their favorite retailer to their favorite restaurant, today’s customers place great value on every interaction they have with a brand. Define and monitor up to 500 key user actions and track historic trends. You can use this feature to monitor key actions with a dedicated dashboard tile and track historic trends.
Digital experience monitoring (DEM) allows an organization to optimize customer experiences by taking into account the context surrounding digital experience metrics. Understanding why a user is experiencing transactional or performance issues enables organizations to achieve greater observability that goes beyond metrics, traces and logs.
Unrealized optimization potential of business processes due to monitoring gaps Imagine a retail company facing gaps in its business process monitoring due to disparate data sources. In our retail company example, older systems are involved in shipping the order. On top of that, the data sources are inconsistent.
Demand for online grocery shopping and home delivery has risen dramatically in the last 12 months, prompting many retailers to strengthen their digital presence. This included the move to a hybrid, multicloud environment, which introduced greater complexity and the need for improved cloud monitoring capabilities. Dynatrace news.
If the mantra in sales is “Always be closing,” the mantra for online retail storefronts is “Always be online.”. Peak loads can overload and crash retailer websites and derail customer interactions. Customer experience has become paramount for retailers, as visitors demand instant responses — especially during times of high volume.
Synthetic clickpath monitors are a great way to automatically monitor and benchmark business-critical workflows 24/7. Checking out of a retail site. Dynatrace helps to ensure these workflows are available globally and performing well so that you can be confident that you’re meeting your SLAs. Contact forms.
Over the past few weeks, a major insurance provider in Colombia instrumented all their core applications infrastructure with Dynatrace, to ensure they have end-to-end visibility and can adequately monitor their mission-critical applications to cope with the increase in patient enquires via their mobile app, due to COVID-19.
Successful deployments of cloud-native workloads at the edge help to reduce costs, boost performance, and improve customer experience. Application observability also helps to improve end-user experiences when combined with Dynatrace Digital Experience monitoring. Data is integrated seamlessly with Kubernetes topology.
Traditional monitoring provides correlations between events, but causal AI goes further by inferring the probabilistic causal relationships between them. Software developers can use causal analysis to identify the root causes of bugs or application performance issues and to predict potential system failures or performance degradations.
For retail organizations, peak traffic can be a mixed blessing. In its pursuit, IT teams hover over system performance dashboards hoping their preparations will deliver five nines—or even four nines—availability. The nightmare scenario for online retailers during peak periods, such as Black Friday and Cyber Monday, is a system crash.
As e-commerce experiences become more sophisticated and we all rely on them more and more, observability for e-commerce applications and the clouds they run on has become more critical than ever to retailers’ success. First, he pointed to the infrastructure monitoring capabilities as critical to understanding the impact of hardware failures.
What stands out as an imperative now is the urgent need for vendors to shift their focus back to customers and resist the temptation to capitalize on the growing demand for extensive data management and monitoring in complex IT environments. A prominent U.S. Slow reaction times, in turn, caused failed customer transactions. Transparency.
They help organizations streamline and automate complex and time-consuming procedures and improve overall performance. With Dynatrace, they now have a single unified platform that measures all the thresholds looking for differences, which makes it easy to find a performance spike in a torrent of data from different sources.
The continued growth of e-commerce has led to digital transformation moving at unprecedented speeds, as retailers compete for the attention of over 2.1 Retailers are increasingly adopting multicloud strategies to gain the agility required to succeed. billion online shoppers. The rise of cloud complexity. A fully automated future.
Log analytics is useful for application performancemonitoring in cloud, virtualized, and physical environments, including Kubernetes workloads, application security, and business analytics. Peak performance analysis. Unfortunately, many organizations have dozens of siloed data collection and monitoring tools and teams.
Log analytics is useful for application performancemonitoring in cloud, virtualized, and physical environments, including Kubernetes workloads, application security, and business analytics. Peak performance analysis. Unfortunately, many organizations have dozens of siloed data collection and monitoring tools and teams.
From banking and retail to healthcare and government, nearly all industries have experienced a dramatic shift to mobile computing over the last decade. Instrumentation enables the shipment of a monitoring library with your app that collects telemetry data and sends it back to the Dynatrace platform for analysis. Get started.
Possible scenarios A retail website crashes during a major sale event due to a surge in traffic. Conducting performance testing and having contingency plans for peak times can help ensure systems remain operational during spikes in usage. This often occurs during major events, promotions, or unexpected surges in usage.
To be ready to deal with crashes, you need a monitoring solution that alerts you to critical events, provides you with an overview of crash events, and enables you to quickly resolve issues that contribute to crashes. Dynatrace continues to work hard to make error and performancemonitoring of mobile apps faster and more intuitive.
While most government agencies and commercial enterprises have digital services in place, the current volume of usage — including traffic to critical employment, health and retail/eCommerce services — has reached levels that many organizations have never seen before or tested against. It is also much less error-prone.
Extend business observability to data at rest In our past blog post about business agility, we looked at a retail sales use case example to investigate potential causes of underperforming store locations. This enables you to identify bottlenecks, optimize user experiences, and make data-driven decisions to improve sales performance.
No matter if your metrics are directly related to application and service performance, or if you just want to support other data analytics use cases within your company, you can now use Dynatrace to collect and analyze every metric that’s important to the various departments of your enterprise. This is not the case with Dynatrace!
Mobile retail e-commerce spending in the U. With so many of their transactions occurring online, customers are becoming more demanding, expecting websites and applications to always perform perfectly. At the lowest level, SLIs provide a view of service availability, latency, performance, and capacity across systems.
Some of these patterns can be planned for , such as peak seasons for travel and retail industries, while others are entirely spontaneous to the business. Perhaps just as important is the ability to consume this information – not just in a monitoring solution but also in external capacity planning solutions. . Performance Metrics.
One recent public example is Zalando, a German retailer. For years, Dynatrace has helped companies across the world with our Real User Monitoring and Synthetic Monitoring solutions for managing application performance. Define your own performance requirements with the more flexible Apdex.
Many enterprise digital marketing teams use the best-in-class web analytics solutions like Adobe Analytics to see which users are abandon ing their journey , how paid search and email campaigns are performing, and to understand user behavior. Real-world example: Retail banking.
With more automated approaches to log monitoring and log analysis, however, organizations can gain visibility into their applications and infrastructure efficiently and with greater precision—even as cloud environments grow. Dynatrace Grail unifies data from logs, metrics, traces, and events within a real-time model.
Today’s organizations face increasing pressure to keep their cloud-based applications performing and secure. As data from different corners of the enterprise proliferates, teams need a better way to bring data together to identify performance and security issues, minimize security risk, and drive greater business value.
It’s an important distinction; many business use cases won’t tolerate sampling or other resource-conservation approaches common to operational monitoring. Business events capture business data from anywhere; they can come from OneAgent, from real-user monitoring (RUM) sessions, from log files, or from external tools and data sources.
Many organizations — particularly those in the securities and investment services, banking, and retail sectors — have also targeted customer experience enhancements. Legacy technology is often a major barrier to digital transformation. Over time, legacy tools can introduce productivity costs.
OpenPipeline ensures data security and privacy—data is collected and processed securely and compliantly, with high-performance filtering, masking, routing, and encryption—and contextualizes incoming data in real time. How logs are ingested Dynatrace offers OpenPipeline to ingest, process, and persist any data from any source at any scale.
FinOps helps engineering, development, finance, and business teams meet critical key performance indicators (KPIs) and fulfill service-level agreements. Today, many global industries implement FinOps, including telecommunications, retail, manufacturing, and energy conservation, as well as most Fortune 50 companies.
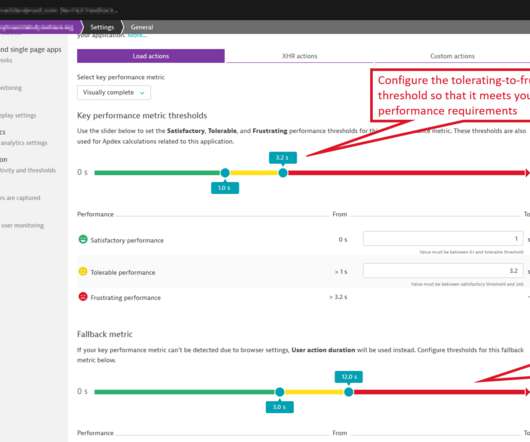
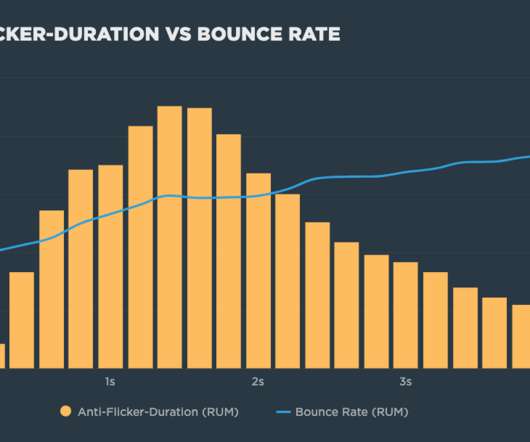
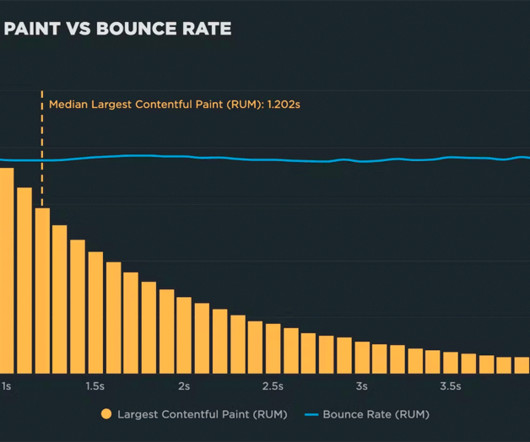
But this practice comes with some performance measurement pitfalls: Hiding the contents of the page can have a dramatic effect on the Web Vitals that measure visual experience, such as First Contentful Paint (FCP) and Largest Contentful Paint (LCP). Update the Optimize anti-flicker snippet to include performance marks and measures.
"How can I demonstrate the business value of performance to people in my organization?" If you've ever asked yourself any of these questions, then you could find the answers in identifying and understanding the performance poverty line for your site. What is the "performance poverty line"?
Non-topology metrics are not related to any Smartscape entity (for example, a retailer’s revenue numbers per store). Instead, the metric is related to the monitored environment as a whole. Choose your monitoring strategy (i.e., OneAgent comes with a new metric ingest channel already enabled.
”, “Are my OneAgents and ActiveGates performing well?”, Thanks to the ease of deployment, the time-to-value for monitoring of such complex environments is very short. Like any other software, OneAgents need to be maintained, updated, and monitored. turning monitoring on and off based on server status in a CMDB.
We organize all of the trending information in your field so you don't have to. Join 5,000+ users and stay up to date on the latest articles your peers are reading.
You know about us, now we want to get to know you!
Let's personalize your content
Let's get even more personalized
We recognize your account from another site in our network, please click 'Send Email' below to continue with verifying your account and setting a password.


Let's personalize your content