This site uses cookies to improve your experience. To help us insure we adhere to various privacy regulations, please select your country/region of residence. If you do not select a country, we will assume you are from the United States. Select your Cookie Settings or view our Privacy Policy and Terms of Use.
Cookie Settings
Cookies and similar technologies are used on this website for proper function of the website, for tracking performance analytics and for marketing purposes. We and some of our third-party providers may use cookie data for various purposes. Please review the cookie settings below and choose your preference.
Used for the proper function of the website
Used for monitoring website traffic and interactions
Cookie Settings
Cookies and similar technologies are used on this website for proper function of the website, for tracking performance analytics and for marketing purposes. We and some of our third-party providers may use cookie data for various purposes. Please review the cookie settings below and choose your preference.
Strictly Necessary: Used for the proper function of the website
Performance/Analytics: Used for monitoring website traffic and interactions
IT infrastructure is the heart of your digital business and connects every area – physical and virtual servers, storage, databases, networks, cloud services. If you don’t have insight into the software and services that operate your business, you can’t efficiently run your business. What is infrastructure monitoring? .
Hyper-V plays a vital role in ensuring the reliable operations of data centers that are based on Microsoft platforms. Microsoft Hyper-V is a virtualization platform that manages virtual machines (VMs) on Windows-based systems. This leads to a more efficient and streamlined experience for users.
Dynatrace is proud to provide deep monitoring support for Azure Linux as a container host operatingsystem (OS) platform for Azure Kubernetes Services (AKS) to enable customers to operate efficiently and innovate faster. Why monitor Azure Linux container host for AKS? Performance.
Digital experience monitoring (DEM) allows an organization to optimize customer experiences by taking into account the context surrounding digital experience metrics. What is digital experience monitoring? Primary digital experience monitoring tools.
Kubernetes has taken over the container management world and beyond , to become what some say the operatingsystem or the new Linux of the cloud. Monitoring Kubernetes is an important aspect of Day 2 o perations and is often perceived as a significant challenge. Monitoring in the Kubernetes world .
Available directly from the AWS Marketplace , Dynatrace provides full-stack observability and AI to help IT teams optimize the resiliency of their cloud applications from the user experience down to the underlying operatingsystem, infrastructure, and services. Auto-detection starts monitoring new virtual machines as they are deployed.
Observability and monitoring as a source of truth. Traces help find the flow of a request through a distributed system. To provide actionable answers monitoringsystems store, baseline, and analyze telemetry data. Based on this analysis, these systems can take actions such as alerting or remediation.
As Dynatrace is a leader in Cloud monitoring, we have architected our Software Intelligence Platform specifically to complement Kubernetes by providing extensive functionality to tame the complexities and prevent performance issues that can occur across the development and deployment cycles. Don’t underestimate complexity.
A message queue is a form of middleware used in software development to enable communications between services, programs, and dissimilar components, such as operatingsystems and communication protocols. A message queue enables the smooth flow of information to make complex systems work. What is a message queue?
A message queue is a form of middleware used in software development to enable communications between services, programs, and dissimilar components, such as operatingsystems and communication protocols. A message queue enables the smooth flow of information to make complex systems work. What is a message queue?
Traditional computing models rely on virtual or physical machines, where each instance includes a complete operatingsystem, CPU cycles, and memory. VMware commercialized the idea of virtual machines, and cloud providers embraced the same concept with services like Amazon EC2, Google Compute, and Azure virtual machines.
While speeding up development processes and reducing complexity does make the lives of Kubernetes operators easier, the inherent abstraction and automation can lead to new types of errors that are difficult to find, troubleshoot, and prevent. Monitoring makes sense of observability data. What does observability mean for Kubernetes?
The OneAgent on a host REST API is critical for us to easily automate the switch between full stack and infrastructure monitoring mode.” Turning monitoring on/off based on server status in a CMDB. Automatically enabling/disabling monitoring of specific hosts. ” – a Dynatrace customer.
IT admins can automate virtually any time-consuming task that requires regular application. Monitoring and logging are fundamental building blocks of observability. When monitoring tools release a stream of alerts, teams can easily identify which ones are false and assess whether an event requires human intervention.
But managing the deployment, modification, networking, and scaling of multiple containers can quickly outstrip the capabilities of development and operations teams. This orchestration includes provisioning, scheduling, networking, ensuring availability, and monitoring container lifecycles. The post What is container orchestration?
Instead, enterprises manage individual containers on virtual machines (VMs). Container-based software isn’t tied to a platform or operatingsystem, so IT teams can move or reconfigure processes easily. In turn, this makes it easier to manage, monitor, and modify containers at scale without sacrificing security.
We’re excited to announce several log management innovations, including native support for Syslog messages, seamless integration with AWS Firehose, an agentless approach using Kubernetes Platform Monitoring solution with Fluent Bit, a new out-of-the-box ingest dashboard, and OpenPipeline ingest improvements.
While microservices vs. monolithic architecture is a common debate, organizations have other considerations, like service-oriented architecture (SOA), tools, monitoring solutions, and potential migration issues. Additional complexity and monitoring challenges. As part of that complexity, monitoring microservices can become a challenge.
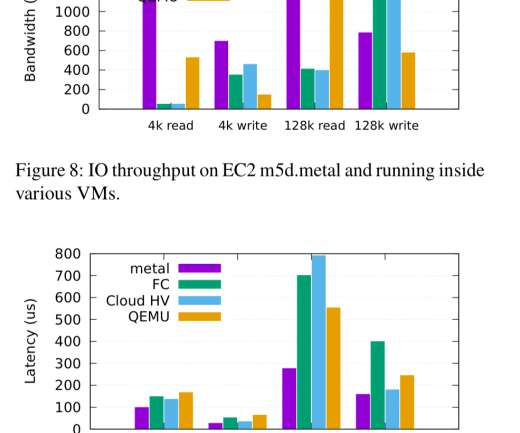
Firecracker is the virtual machine monitor (VMM) that powers AWS Lambda and AWS Fargate, and has been used in production at AWS since 2018. The traditional view is that there is a choice between virtualization with strong security and high overhead, and container technologies with weaker security and minimal overhead.
Observability and monitoring as a source of truth . Traces help find the flow of a request through a distributed system . To provide actionable answers monitoringsystems store, baseline, and analyze telemetry data. Based on th is analysis , these systems can take actions such as alerting or remediation.
Unfortunately, container security is much more difficult to achieve than security for more traditional compute platforms, such as virtual machines or bare metal hosts. These products see systems from the “outside” perspective—which is to say, the attacker’s perspective. Harden the host operatingsystem.
The purpose of infrastructure as code is to enable developers or operations teams to automatically manage, monitor, and provision resources, rather than manually configure discrete hardware devices and operatingsystems. In response, Dynatrace introduced Monaco (Monitoring-as-code). Register now!
Upcoming Operatingsystems support changes. The following operatingsystems will no longer be supported starting 01 February 2021. The following operatingsystems will no longer be supported starting 01 May 2021. The following operatingsystems will no longer be supported starting 01 June 2021.
Kubernetes (aka K8s) is an open-source platform used to run and manage containerized applications and services on clusters of physical or virtual machines across on-premises, public, private, and hybrid clouds. This virtualization makes it possible to efficiently deploy and securely run a container independently of the hosting infrastructure.
Our largest customers are global companies with absolutely massive application stacks, spreading across cloud and enterprise platforms, multiple physical geographies, tens of thousands of virtual and physical hosts and hundreds of thousands of containers. Like any other software, OneAgents need to be maintained, updated, and monitored.
We’re currently in a technological era where we have a large variety of computing endpoints at our disposal like containers, Platform as a Service (PaaS), serverless, virtual machines, APIs, etc. We wanted to take this a step further and apply the Everything as Code methodology to monitoring configurations as well.
As Dynatrace is a leader in Cloud monitoring, we have architected our Software Intelligence Platform specifically to complement Kubernetes by providing extensive functionality to tame the complexities and prevent performance issues that can occur across the development and deployment cycles. Don’t underestimate complexity.
Application performance monitoring (APM) is the practice of tracking key software application performance metrics using monitoring software and telemetry data. Practitioners use APM to ensure system availability, optimize service performance and response times, and improve user experiences. Performance monitoring.
Setting up and monitoring these systems was pretty easy compared to today’s standards. There were no dynamic web applications or complex user scenarios to have to monitor. monitoring distributed systems becomes much more difficult to carry out and manage. What is a Distributed System? Heterogeneity.
Various forms can take shape when discussing workloads within the realm of cloud computing environments – examples include order management databases, collaboration tools, videoconferencing systems, virtual desktops, and disaster recovery mechanisms. This applies to both virtual machines and container-based deployments.
Most existing security features on the timeline fall into one of four categories: • Virtualization—Giving code the illusion that it is in an environment other than the one it is actually being executed on. Attestation—Providing systems the means to attest or verify the integrity of their components.
If the answer to any of those questions was no, then the system wasn't working correctly and I needed to take action to correct it. Beyond the checklist For a simple little website, that was all the monitoring I needed. But over time, the complexity of the systems that I've deployed and monitored has increased.
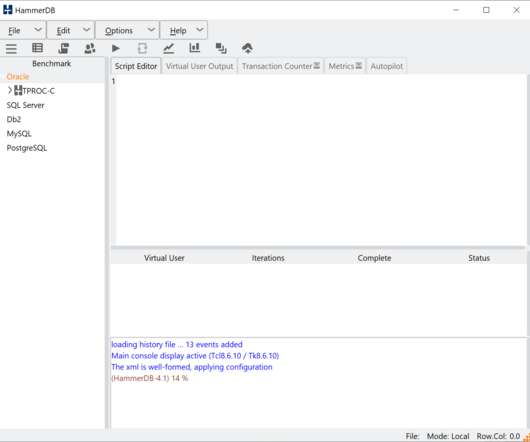
In the example below we have modified the SQL Server, number of warehouses to build and the virtual users to build them. We have set the connection value of mssqls_server and then the tpcc value of the warehouse count and the number of virtual users to build them. GUI Virtual User Options. CLI Virtual User Options.
The success of our early results with the Dynamo database encouraged us to write Amazon's Dynamo whitepaper and share it at the 2007 ACM Symposium on OperatingSystems Principles (SOSP conference), so that others in the industry could benefit. This was the genesis of the Amazon Dynamo database.
These acronyms, which stand for real user monitoring and application performance monitoring, are software monitoring processes essential to measuring and evaluating applications in many different areas. What is real user monitoring (RUM)? What is application performance monitoring (APM)?
And when discussing the two types of data, we’re actually talking about what is called real-user monitoring , or RUM for short. For example, the data is pretty slow to update, refreshing every 28 days, meaning it is not the same as real-time monitoring. But it comes with caveats. Does Lighthouse Use RUM Data, Too?
By employing distributed storage techniques, continuous monitoring becomes possible — this proves crucial for maintaining equipment that helps prevent hazardous incidents before they occur and contributes significantly to life preservation initiatives.
Apart from disconnections, another cause of worry is the inability to access virtual environments which are generally used by the testers for testing applications. QA teams need to have a good monitoring solution in place that can help fix the issue as soon as it occurs and prevent the whole software delivery pipeline from getting affected.
So it just makes sense to instantiate microservices at the level of the virtual machine (VM), as distinct to that of the container. It’s the kind of hard problem that cannot be wished, willed, or architected away–indeed, replacing a monolithic system with microservices can be seen as a “lump sum” payment of years of accrued technical debt.
But for the uninitiated, on-premise testing is a form of testing where testers perform tests on local machines, systems, or devices set up at an office. From the maintenance and monitoring of the machines and software to upgrading and installations — you’ll need all hands on deck. As the name suggests, it happens on-premise.
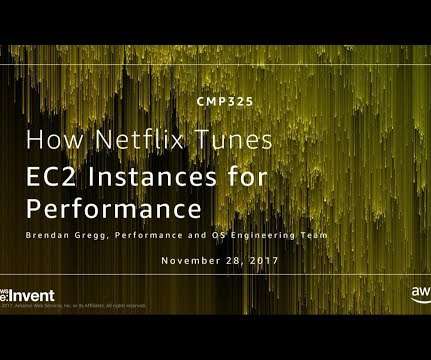
A video of the talk is on youtube : The slides are on slideshare : I love this talk as I get to share more about what the Performance and OperatingSystems team at Netflix does, rather than just my work. Virtual Memory. File System. Fortunately, it was videoed for those who missed it. schedtool –B PID. Huge Pages.
Additionally, end users can access your site or applications from anywhere in the world using different browsers, operatingsystems, and mobile devices, all with varying connection speeds. Shift Right – Monitoring Performance after Deployment.
A video of the talk is on youtube : The slides are on slideshare : I love this talk as I get to share more about what the Performance and OperatingSystems team at Netflix does, rather than just my work. Virtual Memory. File System. Fortunately, it was videoed for those who missed it. schedtool –B PID. Huge Pages.
In this blog post, we will discuss the best practices on the MongoDB ecosystem applied at the OperatingSystem (OS) and MongoDB levels. OperatingSystem (OS) settings Swappiness Swappiness is a Linux kernel setting that influences the behavior of the Virtual Memory manager when it needs to allocate a swap, ranging from 0-100.
We organize all of the trending information in your field so you don't have to. Join 5,000+ users and stay up to date on the latest articles your peers are reading.
You know about us, now we want to get to know you!
Let's personalize your content
Let's get even more personalized
We recognize your account from another site in our network, please click 'Send Email' below to continue with verifying your account and setting a password.


Let's personalize your content