This site uses cookies to improve your experience. To help us insure we adhere to various privacy regulations, please select your country/region of residence. If you do not select a country, we will assume you are from the United States. Select your Cookie Settings or view our Privacy Policy and Terms of Use.
Cookie Settings
Cookies and similar technologies are used on this website for proper function of the website, for tracking performance analytics and for marketing purposes. We and some of our third-party providers may use cookie data for various purposes. Please review the cookie settings below and choose your preference.
Used for the proper function of the website
Used for monitoring website traffic and interactions
Cookie Settings
Cookies and similar technologies are used on this website for proper function of the website, for tracking performance analytics and for marketing purposes. We and some of our third-party providers may use cookie data for various purposes. Please review the cookie settings below and choose your preference.
Strictly Necessary: Used for the proper function of the website
Performance/Analytics: Used for monitoring website traffic and interactions
We’re continuously working to support the most popular operatingsystems with high quality OneAgent deployment options. We plan to desupport monitoring of 32-bit hosts (hosts that run on 32-bit OS versions) that are monitored by OneAgents. Monitoring of such applications will continue to be supported.
Log monitoring, log analysis, and log analytics are more important than ever as organizations adopt more cloud-native technologies, containers, and microservices-based architectures. A log is a detailed, timestamped record of an event generated by an operatingsystem, computing environment, application, server, or network device.
IBM i, formerly known as iSeries, is an operatingsystem developed by IBM for its line of IBM i Power Systems servers. It is based on the IBM AS/400 system and is known for its reliability, scalability, and security features. Nothing is installed on your IBM i systems. It’s all monitored remotely !
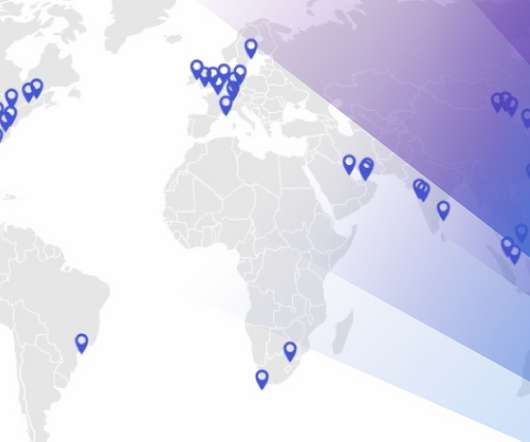
With almost 100 public locations worldwide, Dynatrace Synthetic Monitoring enables 24/7 measurement of the availability and performance of your applications as experienced by your customers and coworkers worldwide. With Dynatrace private Synthetic locations, we make the monitoring of internal applications easy! Try it out for yourself.
Kubernetes has taken over the container management world and beyond , to become what some say the operatingsystem or the new Linux of the cloud. Monitoring Kubernetes is an important aspect of Day 2 o perations and is often perceived as a significant challenge. Monitoring in the Kubernetes world .
Dynatrace is proud to provide deep monitoring support for Azure Linux as a container host operatingsystem (OS) platform for Azure Kubernetes Services (AKS) to enable customers to operate efficiently and innovate faster. Why monitor Azure Linux container host for AKS? Performance.
Digital experience monitoring (DEM) allows an organization to optimize customer experiences by taking into account the context surrounding digital experience metrics. What is digital experience monitoring? Primary digital experience monitoring tools.
A cornerstone of Dynatrace monitoring capabilities, OneAgent boosts your log ingestion experience by automatically detecting and tagging logs based on the detected process technologyeven for custom-developed applications. Ready to consolidate your logs and monitoring tools in Dynatrace? Configuration is fully customizable.
If you use Windows, you will want to monitor Windows Events. A recent contribution of a distribution of the OpenTelemetry (OTel) Collector makes it much easier to monitor Windows Events with OpenTel. Windows Events logs record many different operatingsystem processes, application activity, and account activity.
If you don’t have insight into the software and services that operate your business, you can’t efficiently run your business. This shift requires infrastructure monitoring to ensure all your components work together across applications, operatingsystems, storage, servers, virtualization, and more.
A key part of monitoring your Windows hosts are Windows services (i.e., These services are responsible for core components of the Windows operatingsystem and third-party applications. Windows-based infrastructure monitoring. Alerting makes availability monitoring actionable. They can be paused and restarted.
As Dynatrace is a leader in Cloud monitoring, we have architected our Software Intelligence Platform specifically to complement Kubernetes by providing extensive functionality to tame the complexities and prevent performance issues that can occur across the development and deployment cycles. Don’t underestimate complexity.
We’re proud to introduce a significant improvement to Dynatrace Log Monitoring that will empower all your teams. With Dynatrace Log monitoring, you’re only one click away from investigating the log events that were captured during the problem time frame and beginning any required remediation efforts. Dynatrace news.
We’re happy to announce the launch of Dynatrace Synthetic private browser monitors! We continue to grow our public synthetic monitoring locations, but customers using Dynatrace Synthetic still need to monitor the performance and availability of internal web applications. Monitor your internal apps from within your offices.
Dynatrace Synthetic Monitoring , in combination with Real User Monitoring and Session Replay , makes Dynatrace the market-leading digital experience monitoring solution. With Synthetic Monitoring, you can easily check the availability and performance of your applications as well as your APIs. Zurich (Switzerland).
A message queue is a form of middleware used in software development to enable communications between services, programs, and dissimilar components, such as operatingsystems and communication protocols. A message queue enables the smooth flow of information to make complex systems work. What is a message queue?
A message queue is a form of middleware used in software development to enable communications between services, programs, and dissimilar components, such as operatingsystems and communication protocols. A message queue enables the smooth flow of information to make complex systems work. What is a message queue?
Observability and monitoring as a source of truth. Traces help find the flow of a request through a distributed system. To provide actionable answers monitoringsystems store, baseline, and analyze telemetry data. Based on this analysis, these systems can take actions such as alerting or remediation.
In April of this year, we released a long-awaited GA version of the full-stack OneAgent for the IBM AIX operatingsystem. AIX is considered to be one of the core operatingsystems used by our largest customers. Fully automatic deep code monitoring module injection. TL9 SP9 (see details below). This is why AIX 6.1
Extended Berkeley Packet Filter (eBPF) is a programming technology designed for the Linux operatingsystem (OS) kernel space, enabling developers to create efficient, secure, and non-intrusive programs.
Synthetic-enabled ActiveGates are crucial elements of private Synthetic Monitoring locations. Easily run private synthetic monitors on your favorite OS version. The post Private Synthetic Monitoring locations now supported on Red Hat 8, Ubuntu 18, and CentOS 8 appeared first on Dynatrace blog. Dynatrace news.
Application Performance Monitoring (APM) in its simplest terms is what practitioners use to ensure consistent availability, performance, and response times to applications. Websites, mobile apps, and business applications are typical use cases for monitoring. Performance monitoring. Application monitoring. Dynatrace news.
With the availability of Linux on IBM Z and LinuxONE, the IBM Z platform brings a familiar host operatingsystem and sustainability that could yield up to 75% energy reduction compared to x86 servers. Deploying your critical applications on additional host operatingsystems increases the dependencies for observability.
The GA version of private synthetic HTTP monitoring was so well received that we expanded beyond Linux-based environment ActiveGates to now additionally support Windows-based environment ActiveGates. Why use synthetic HTTP monitors? Private HTTP monitors, being very lightweight, are great for: API testing (both internal and external).
Do you keep an eye on the support of distributions and versions of operatingsystems within your environment? With this information, you can find answers to questions such as: Which operatingsystems and versions does Dynatrace support? Which operatingsystems and versions does Dynatrace support?
Available directly from the AWS Marketplace , Dynatrace provides full-stack observability and AI to help IT teams optimize the resiliency of their cloud applications from the user experience down to the underlying operatingsystem, infrastructure, and services. Auto-detection starts monitoring new virtual machines as they are deployed.
Introduction to HertzBeat HertzBeat is an open source, easy-to-use and friendly real-time monitoringsystem that does not require Agent and has powerful custom monitoring capabilities. Do you believe that you can immediately adapt to a new monitoring type, such as K8s or Docker, just by configuring YML? Github: [link]
Hyper-V plays a vital role in ensuring the reliable operations of data centers that are based on Microsoft platforms. Microsoft Hyper-V is a virtualization platform that manages virtual machines (VMs) on Windows-based systems. Start monitoring Hyper-V Navigate to the Dynatrace Hub and activate the Microsoft Hyper-V Extension.
As we did with IBM Power , we’re delighted to share that IBM and Dynatrace have joined forces to bring the Dynatrace Operator, along with the comprehensive capabilities of the Dynatrace platform, to Red Hat OpenShift on the IBM Z and LinuxONE architecture (s390x). This is significant when coupled with the OpenShift platform.
We’re proud to announce the general availability of OneAgent full-stack monitoring for the AIX operatingsystem. We’ve already reached a percentage of monitored AIX hosts running OneAgent that is equivalent to AIX market share. Full-stack and cloud-infrastructure monitoring modes. Installation.
This growth was spurred by mobile ecosystems with Android and iOS operatingsystems, where ARM has a unique advantage in energy efficiency while offering high performance. Initiatives like the Carbon Impact app can be used to measure the footprint of monitored ARM-based hosts compared to x86 hosts.
Modern observability and security require comprehensive access to your hosts, processes, services, and applications to monitorsystem performance, conduct live debugging, and ensure application security protection. These tests are run on all supported operatingsystems and versions to enhance reliability.
As a result, organizations need to monitor mobile app performance metrics that are meaningful and actionable by gaining adequate observability of mobile app performance. Closely monitoring mobile app performance will help ensure customer interactions via mobile apps are meeting the expectations of the customers. Proactive monitoring.
For the CrowdStrike issue, one can use both monitored Windows System logs and the Dynatrace entity model to find out what servers are impacted. The following is an example of a query using the Dynatrace Query Language (DQL) to find out when BSOD issues are being written to Windows System logs.
It offers automated installation, upgrades, and life cycle management throughout the container stack — the operatingsystem, Kubernetes and cluster services, and applications — on any cloud. OpenShift empowers easy integration with leading CI/CD platforms, AI-powered performance monitoring solutions, and user-demand analysis tools.
In todays data-driven world, the ability to effectively monitor and manage data is of paramount importance. With its widespread use in modern application architectures, understanding the ins and outs of Redis monitoring is essential for any tech professional. Redis, a powerful in-memory data store, is no exception.
The load testing for the database needs to be conducted usually so that the impact on the system can be monitored in different scenarios, such as query language rule optimization, storage engine parameter adjustment, etc. The operatingsystem in this article is the x86 CentOS 7.8.
Many customers try to use traditional tools to monitor and observe modern software stacks, but they struggle to deal with the dynamic and changing nature of cloud environments. When an application runs on a single large computing element, a single operatingsystem can monitor every aspect of the system.
Offering comprehensive access to files, software features, and the operatingsystem in a more user-friendly manner to ensure control. Cross-Platform Compatibility: Is the tool available on multiple operatingsystems (Windows, macOS, Linux)? Providing windows to streamline multitasking through programs and file structures.
Starting with version 1.216, for fresh-installed Dynatrace Managed, the private Synthetic browser monitor screenshots are stored on the Cluster, and not uploaded to the S3 bucket. Operatingsystems support. Future Dynatrace Managed operatingsystems support changes. New features and enhancements. x86 (64bit-only).
Because OneAgent operates on your critical hosts where the services that comprise your business applications are located, Dynatrace must ensure the highest possible security in monitoring the operatingsystems and services that run on these hosts. Non-privileged mode will be the default for OneAgent on Linux.
Traditional computing models rely on virtual or physical machines, where each instance includes a complete operatingsystem, CPU cycles, and memory. There is no need to plan for extra resources, update operatingsystems, or install frameworks. The provider is essentially your system administrator.
It offers automated installation, upgrades, and lifecycle management throughout the container stack – the operatingsystem, Kubernetes and cluster services, and applications – on any cloud. Containers can be challenging to monitor as they are always changing. What is OpenShift? Red Hat OpenShift is a hybrid cloud platform.
Dynatrace Synthetic Monitoring , in combination with Real User Monitoring and Session Replay , makes Dynatrace the market-leading digital experience monitoring solution. With Synthetic Monitoring, you can easily check the availability and performance of your applications as well as your APIs. Zurich (Switzerland).
We organize all of the trending information in your field so you don't have to. Join 5,000+ users and stay up to date on the latest articles your peers are reading.
You know about us, now we want to get to know you!
Let's personalize your content
Let's get even more personalized
We recognize your account from another site in our network, please click 'Send Email' below to continue with verifying your account and setting a password.


Let's personalize your content