This site uses cookies to improve your experience. To help us insure we adhere to various privacy regulations, please select your country/region of residence. If you do not select a country, we will assume you are from the United States. Select your Cookie Settings or view our Privacy Policy and Terms of Use.
Cookie Settings
Cookies and similar technologies are used on this website for proper function of the website, for tracking performance analytics and for marketing purposes. We and some of our third-party providers may use cookie data for various purposes. Please review the cookie settings below and choose your preference.
Used for the proper function of the website
Used for monitoring website traffic and interactions
Cookie Settings
Cookies and similar technologies are used on this website for proper function of the website, for tracking performance analytics and for marketing purposes. We and some of our third-party providers may use cookie data for various purposes. Please review the cookie settings below and choose your preference.
Strictly Necessary: Used for the proper function of the website
Performance/Analytics: Used for monitoring website traffic and interactions
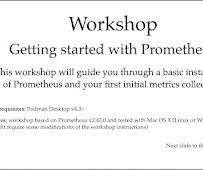
This workshop is for you, designed to expand your knowledge and understanding of open-source observability tooling that is available to you today. Dive right into a free, online, self-paced, hands-on workshop introducing you to Prometheus. Are you interested in open-source observability, but lack the knowledge to just dive right in?
This workshop is for you, designed to expand your knowledge and understanding of open-source observability tooling that is available to you today. Dive right into a free, online, self-paced, hands-on workshop introducing you to Prometheus. Are you interested in open-source observability, but lack the knowledge to just dive right in?
This workshop is for you, designed to expand your knowledge and understanding of open-source observability tooling that is available to you today. Dive right into a free, online, self-paced, hands-on workshop introducing you to Prometheus. Are you interested in open-source observability but lack the knowledge to just dive right in?
With all the technology changes through the past three years, with the world moving to K8s, the rise of GitOps, everything as code, event-driven automation, and many new open standards in the cloud-native space, it was time to update our workshop. Last week we kicked it off with a three-hour virtual hands-on workshop.
This second blog will take a deeper dive into the Metrics, Logs, and Tracing exporters (which can be found at [link] ), describing them and showing how to configure them, Grafana, alerts, etc. All of the code for the workshop can also be found at the [link] repos (specifically in the observability directory).
Everything discussed here is supported by a hands-on, self-paced workshop authored by Paige Cruz. By the end of this series, you'll have an understanding of how telemetry travels from your applications to the OpenTelemetry Collector, and be ready to bring OpenTelemetry to your future projects.
In a recent workshop I did with a global player in the financial market we used their new mobile banking app as a reference. In the workshop, I also answered the question: How can we measure those metrics (=SLIs) that are behind our objectives? Whether its our Metrics Ingest API or building a Dynatrace Extension.
Everything discussed here is supported by a hands-on, self-paced workshop authored by Paige Cruz. By the end of this series, you'll have an understanding of how telemetry travels from your applications to the OpenTelemetry Collector, and be ready to bring OpenTelemetry to your future projects.
I am available to help you find and fix your site-speed issues through performance audits , training and workshops , consultancy , and more. Web Vitals I still feel that site owners who are serious about web performance should augment Core Web Vitals with their own custom metrics (e.g. You should get in touch.
Define the strategy, assess the environment, and perform migration-readiness assessments and workshops. In Figure 7, we can pick the service from the service flow, look at the metrics, and then compare the performance changes in a single, built-in Dynatrace feature. However, the foundational stages are similar: Assess and discover.
A Type-M error occurs when, given that we observe a statistically-significant result, the size of the estimated metric movement is magnified (or exaggerated) relative to the truth. We’ve run many tests in this area and use the distribution of metric movements from past tests as an additional input to the analysis. Sensitivity analysis.
My involvement with clients here is usually workshops and training: teaching developers the knowledge and tooling required to effectively conduct performance audits, and making teams self-sufficient. Do changes in performance correlate to changes in business metrics? Who: Engineers. When: During development.
For 420 subsampling encodes, the quality metrics were computed in 420 subsampling domain. Likewise, for 444 subsampling encodes, the quality metrics were computed in 444 subsampling domain. Given a quality metric, for each image, we consider two separate rate-quality curves.
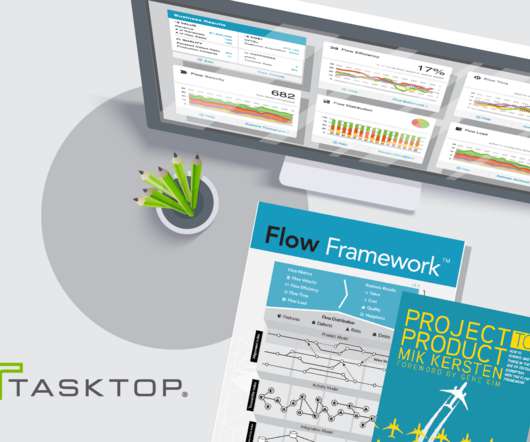
While DevOps Research and Assessment (DORA) metrics help you deliver more quickly, Flow Metrics —as defined by Dr. Mik Kersten as part of his pioneering Value Stream Management paradigm the Flow Framework® —help you deliver the right things more quickly at the right quality and cost and with the necessary team engagement.
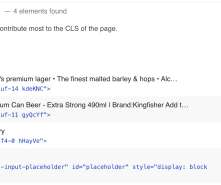
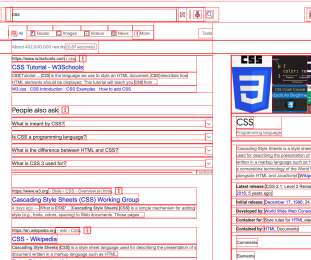
There are many key performance indicators (KPI) that measure different points during the lifecycle of the web page (such as TTFB, domInteractive and onload ), but these metrics don’t reflect how the end-user experiences the page. We found out user-centric performance metrics to be the perfect fit for this purpose. More after jump!
Understanding flow metrics and how to access the data to support data-driven conversations and decisions. Examining value realization metrics and aligning to business outcomes, and how to sense and respond to them (outcomes versus outputs). Architecting a DevOps toolchain alongside a value stream and data connection points.
The answer is Flow Metrics. Flow Metrics, as set out by the Flow Framework , expose big picture problems to help you make better business decisions. Even better, Flow Metrics use a language that business people can understand. 5 Everyday Problems Exposed by Flow Metrics. Here’s where a speed metric is useful.
For a recent technical workshop I did with one of our strategic cloud partners, I created a deck that aims to answer exactly this question. The key question we keep getting from our customers is: How can Dynatrace help me reduce risk, move faster and achieve a better business outcome for my cloud migration project?
These existing metrics only help improve flow if that silo is itself the bottleneck. Once you have identified where your bottlenecks are, you can use your discipline metrics to probe and investigate the issues at hand. They provide shared visibility into business and development metrics for everyone involved in the value stream.
Flow 101 Workshop (with Dominica DeGrandis): Flow is the continuous smooth and fast delivery of business value, and is the first of the three foundational principles underpinning DevOps. This two-day hands-on workshop shows you how to enable flow in your organization using lean practices. Learn more. Learn more.
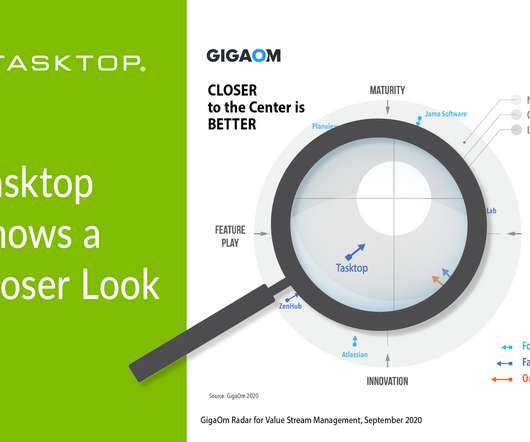
An online investment firm discovering a system bottleneck impeding digital channel innovation , t he remarkable success that organizations are witnessing with flow-based value stream metrics provides an exciting glimpse of what’s possible. Discover “Eureka!”
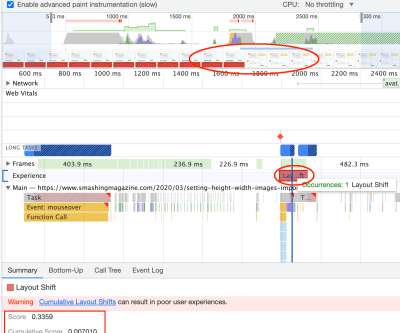
Looking briefly at the other two Core Web Vitals, Largest Contentful Paint (LCP) does exactly as its name suggests and is more of a twist on previous loading metrics that measures how quickly the page loads. That’s not to say solving issues with these two metrics are easy, but they are reasonably well-understood problems.
IBM's Daniel Berg, who is giving a talk on Istio at the upcoming OSCON conference in Portland , recently led a hands-on workshop at KubeCon in Copenhagen to help developers learn how Istio can solve common challenges with microservices deployed within Kubernetes. Developers at the "Istio Hands-on Workshop" at KubeCon in Copenhagen.
Our perspective on VSM has been built on two decades of software delivery experience working with the most impactful organizations, with the Flow Framework® and Flow Metrics now considered best practice to execute and guide a VSM journey. We offer highly-interactive VSM workshops with our value stream experts.
Targets and Metrics Clear targets with measurable outcomes help to solidify an AMET’s mission, keep tabs on the level and speed of progress, and communicate the team’s. However, an AMET is not solely responsible for certain modernization metrics; it may derive its input metrics that more precisely track their contribution.
If customers get fed up and don’t renew, the metrics look bad, investors put their money elsewhere, and analysts decide to recommend other companies. Flow 101 Workshop (with Dominica DeGrandis): Flow is the continuous smooth and fast delivery of business value, and is the first of the three foundational principles underpinning DevOps.
The three-day event is jam-packed full of keynotes, breakouts, workshops (and, not to mention, parties!) Time Theft: Using Flow Metrics to Expose Crimes from Conflicting Priorities and Unplanned Work. designed to help attendees take their DevOps initiatives to the next level. . Wednesday, June 26 at 2:10pm – Cutty Sark.
We see this pattern over and over again when IT organizations attain initial baseline Flow Metrics of product value streams with Tasktop Viz. This is a common phenomenon when the entire value stream set of activities is made visible through Flow Metrics. Most notable is the Flow Load, a metric for WIP.
With the right set of business-centric metrics that focus on the flow of work across the product value stream, IT and business leaders can leverage objective real-time data to identify the bottlenecks slowing them down, inform investment strategy, and measure the impact of changes to steer them in the right direction. To paraphrase W.
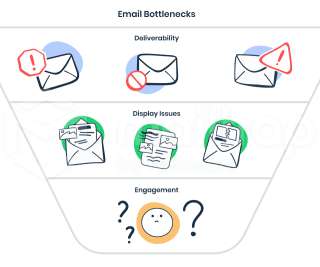
Are You Keeping On Top Of Your Email Metrics? With any type of email you send, you need to track at least these metrics: Open rate. In his upcoming online workshop The TypeScript Masterclass , Stefan Baumgartner will dive into type systems and how to use them well when writing JavaScript. Jump to the workshop ?.
The Flow Framework ties the Flow Metrics of a product value stream to business results. At any point in time, you can visualize the changes in inputs that cause an increase or decrease in value to the business and the metrics themselves. It is their own story to write and catalyze, and inspire more teams to join in. Learn more.
Meet Smashing Online Workshops on front-end & UX , with practical takeaways, live sessions, video recordings and a friendly Q&A. Jump to online workshops ?. Several metrics centre on the time after which users can interact with the page. So, improving performance will have a tangible effect on the bottom line.
Once all tools are connected from end-to-end, you have a traceable and visible workflow that enables you to begin reporting and measuring performance through powerful Flow Metrics. . This two-day hands-on workshop shows you how to enable flow in your organization using lean practices. Learn more. Learn more.
Continue reading below ↓ Meet Smashing Online Workshops on front-end & UX , with practical takeaways, live sessions, video recordings and a friendly Q&A. Jump to online workshops ?. A more recent hot topic in site performance and related metrics is Cumulative Layout Shift (CLS). More after jump! Debugging Overflow.
Enables visibility and traceability into the value stream: When managers want to see metrics and dashboards to understand project status, to optimize the process or to ensure compliance, it has been nearly impossible to get a real-time, holistic view across unintegrated tools. Learn more. Learn more.
The following day I had the opportunity to be in a workshop breakout group with the legendary Grady Booch, who not only showed me the methodology that he had co-created with UML, but also amazed me with a demo of his Rational Rose product, which I immediately got a license for and used incessantly thereafter.
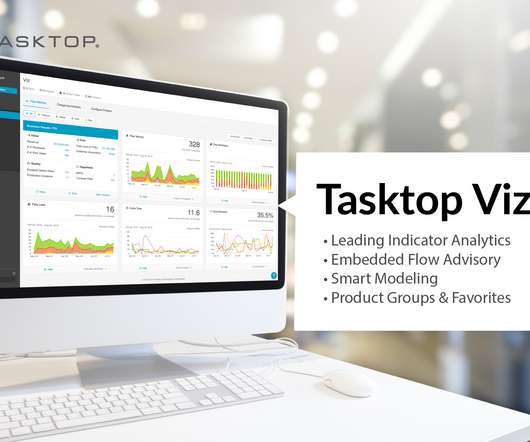
Once you have your baseline Flow Metrics , you ask yourself two questions: 1) What changes can we make to go faster? . Our Flow Advisors accompany our customers on their journeys and teach them how to practice data-driven VSM with Flow Metrics. Smart Modeling shortens the time to metrics down to just minutes. Smart Modeling.
Using a set of value stream metrics, called Flow Metrics , you can measure the rate of delivery across your PVS against desired business results such as revenue, cost, quality and employee job happiness. Flow Metrics, from the Flow Framework®, define the spectrum of value creation in software delivery. Seeing is Believing .
However, the point of this article, for those of us working to apply value stream management (VSM) to the complex world of enterprise software delivery, is that our clutter, our messy closet, our equivalent of a scattershot workshop exists in our work in progress (WIP).
Learn from the experts: Value Stream Management Workshops. Watch the webinar on-demand: Leveraging Flow Metrics and SAFe ® to Drive Business Outcomes. Thank you for your patience as we work to bring you an improved Customer Care experience. . Learn More. Get started with VSM with this guide: What Is a Product Value Stream?
Continue reading below ↓ Meet Smashing Online Workshops on front-end & UX , with practical takeaways, live sessions, video recordings and a friendly Q&A. Jump to online workshops ?. More after jump! On design systems, CSS/JS and UX. With Carie Fisher, Stefan Baumgartner and so many others. Performance Costs.
A later version of the slides is included in my Microservices Workshop deck from later that year, slides 168–200 ( pdf , keynote are available in GitHub.com/adrianco/slides ). This seems reasonable overhead for a real time algorithm that could be applied to histogram data as part of a metric collection pipeline. >
This was a keynote presentation at the “2nd International Workshop on Performance Modeling: Methods and Applications” (PMMA16), June 23, 2016, Frankfurt, Germany (in conjunction with ISC16 ). It is better than peak MFLOPS, but still has roughly a factor of three range when projecting in either direction.).
It was easy - and very satisfying - to nerd out on the management metrics, creating forecasts of scope expansion and capacity and so forth. But one thing that distinguishes the Agile manager from the traditional manager is that the team drives the metrics. The metrics are only very rarely used to drive the team.
We organize all of the trending information in your field so you don't have to. Join 5,000+ users and stay up to date on the latest articles your peers are reading.
You know about us, now we want to get to know you!
Let's personalize your content
Let's get even more personalized
We recognize your account from another site in our network, please click 'Send Email' below to continue with verifying your account and setting a password.


Let's personalize your content