This site uses cookies to improve your experience. To help us insure we adhere to various privacy regulations, please select your country/region of residence. If you do not select a country, we will assume you are from the United States. Select your Cookie Settings or view our Privacy Policy and Terms of Use.
Cookie Settings
Cookies and similar technologies are used on this website for proper function of the website, for tracking performance analytics and for marketing purposes. We and some of our third-party providers may use cookie data for various purposes. Please review the cookie settings below and choose your preference.
Used for the proper function of the website
Used for monitoring website traffic and interactions
Cookie Settings
Cookies and similar technologies are used on this website for proper function of the website, for tracking performance analytics and for marketing purposes. We and some of our third-party providers may use cookie data for various purposes. Please review the cookie settings below and choose your preference.
Strictly Necessary: Used for the proper function of the website
Performance/Analytics: Used for monitoring website traffic and interactions
In this short video, Rudy de Busscher shows how to connect MicroProfile Metrics with Prometheus and Grafana to produce useful graphics and to help investigate your microservice architecture. The goal of MicroProfile Metrics is to expose monitoring data from the implementation in a unified way.
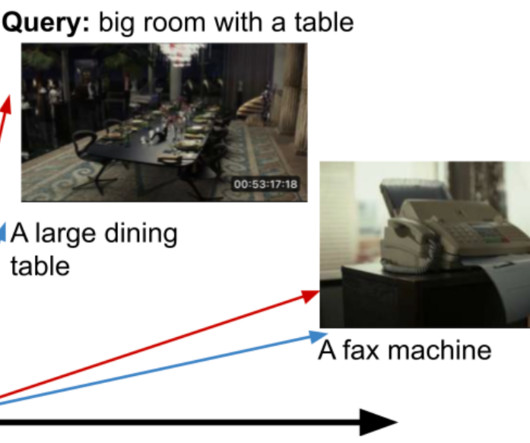
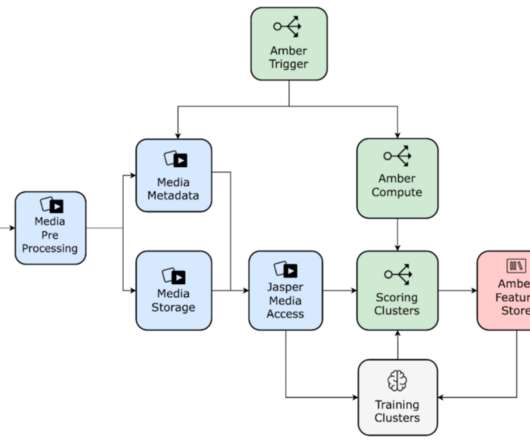
We have built an internal system that allows someone to perform in-video search across the entire Netflix video catalog, and we’d like to share our experience in building this system. Building in-video search To build such a visual search engine, we needed a machine learning system that can understand visual elements.
by Mariana Afonso , Anush Moorthy , Liwei Guo , Lishan Zhu , Anne Aaron Netflix has been one of the pioneers of streaming video-on-demand content?—?we we announced our intention to stream video over 13 years ago, in January 2007?—?and how long it takes for the video to start playing), rebuffer rates, etc.,
You can now: Kickstart your creation journey using ready-made dashboards Accelerate your data exploration with seamless integration between apps Start from scratch with the new Explore interface Search for known metrics from anywhere Let’s look at each of these paths through an end-to-end use case focused on Kubernetes monitoring.
by Aditya Mavlankar , Zhi Li , Lukáš Krasula and Christos Bampis High dynamic range ( HDR ) video brings a wider range of luminance and a wider gamut of colors, paving the way for a stunning viewing experience. HDR was launched at Netflix in 2016 and the number of titles available in HDR has been growing ever since.
For years, logs have been the dominant approach many observability vendors have taken to report business metrics on dashboards. Within the target pipeline, you can also define processing rules, extract metrics, set the security context, and define retention periods.
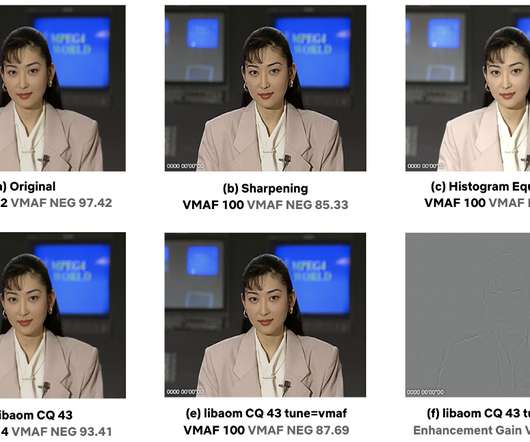
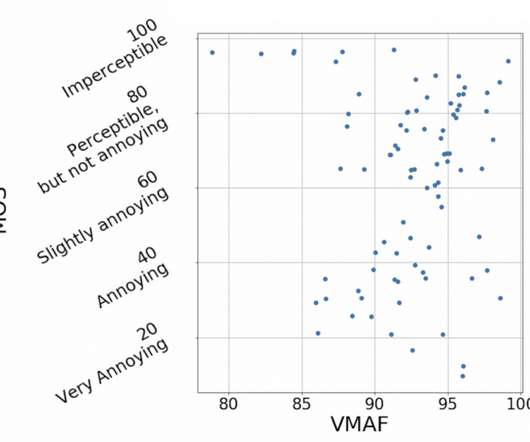
by Zhi Li, Kyle Swanson, Christos Bampis, Lukáš Krasula and Anne Aaron Over the past few years, we have been striving to make VMAF a more usable tool not just for Netflix, but for the video community at large. VMAF is a video quality metric that Netflix jointly developed with a number of university collaborators and open-sourced on Github.
Chances are, youre a seasoned expert who visualizes meticulously identified key metrics across several sophisticated charts. Seasonal Baseline: Ideal for metrics with predictable seasonal patterns, this option leverages Davis AI to create a confidence band based on historical data, accounting for expected variations.
As a result, organizations need to monitor mobile app performance metrics that are meaningful and actionable by gaining adequate observability of mobile app performance. There are many common mobile app performance metrics that are used to measure key performance indicators (KPIs) related to user experience and satisfaction.
Explore OpenTelemetry data with Dynatrace Dynatrace makes unified observability possible by storing all data in Grail, a unified and purpose-built data lakehouse optimized for storing and analyzing traces, metrics, logs, and more. With Notebooks , you can Chart, analyze, set up alerts, and forecast any of your metrics. Whats next?
The Dynatrace platform automatically captures and maps metrics, logs, traces, events, user experience data, and security signals into a single datastore, performing contextual analytics through a “power of three AI”—combining causal, predictive, and generative AI. Watch video Want to go deeper? What’s behind it all?
Dynatrace metric events offer the flexibility needed to customize your anomaly detection configuration. Metric events give you the power to transform and combine one or more metrics and choose one of the built-in monitoring strategies so that entities can be evaluated independently. There are two stages where data is analyzed.
Moorthy and Zhi Li Introduction Measuring video quality at scale is an essential component of the Netflix streaming pipeline. Perceptual quality measurements are used to drive video encoding optimizations , perform video codec comparisons , carry out A/B testing and optimize streaming QoE decisions to mention a few.
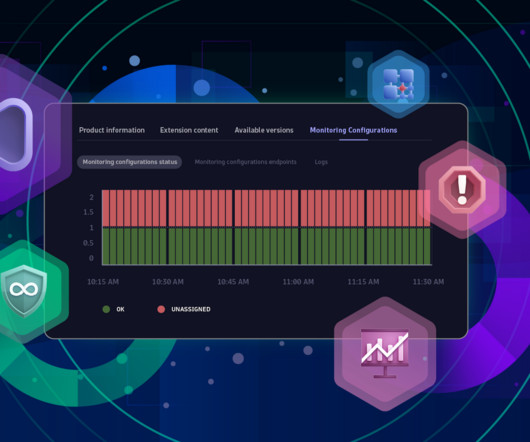
Video 1: Installing extensions from the Hub However, the opposite situation can happen as well. Video 2: Expanding database monitoring according to discovery findings The condition of the databases is one of the most significant factors indicating the health of the whole application. Extensions bring you a load of metrics.
Amazon Bedrock , equipped with Dynatrace Davis AI and LLM observability , gives you end-to-end insight into the Generative AI stack, from code-level visibility and performance metrics to GenAI-specific guardrails. Video overview of Amazon Bedrock dashboard with Dynatrace AI and LLM Observability solution.
Finally, Dynatrace requires metrics data to be sent with delta temporality , not cumulative temporality. This means that youll need to include the cumulativetodelta processor in: Your Collector configuration ( cumulativetodelta ) Your metrics pipeline ( pipelines.metrics ) Never store your Dynatrace token and tenant name in plain text.
We could also swap out the implementation of a field from GraphQL Shim to Video API with federation directives. So, we relied on higher-level metrics-based testing: AB Testing and Sticky Canaries. To determine customer impact, we could compare various metrics such as error rates, latencies, and time to render. How does it work?
Recently introduced improvements to Visually complete and new web performance metrics for Real User Monitoring are now available for Synthetic Monitoring as well. Ensure better user experience with paint-focused performance metrics. These metrics are tightly connected to the perceived load speed of your application.
All metrics, traces, and real user data are also surfaced in the context of specific events. With Dynatrace, you can create custom metrics based on user-defined log events. Also depicted is Dynatrace instrumentation of the pods that deliver metrics and trace data to the Dynatrace environment.
Video – Over the past couple of years, video has proliferated hugely. This is a potential cause for concern for anyone who cares about metrics like Largest Contentful Paint, which measures the largest visual element on a page – including videos. Learn how to optimize images. More on that below.)
As the number of 4K titles in our catalog continues to grow and more devices support the premium features, we expect these video streams to have an increasing impact on our members and the network. We also show the corresponding full frame which helps to get a sense of how the cutout fits in the corresponding video frame.
To reduce your CloudWatch costs and throttling, you can now select from additional services and metrics to monitor. Get up to 300 new AWS metrics out of the box. Dynatrace ingests AWS CloudWatch metrics for multiple preselected services. Amazon Kinesis Video Streams. Select Add metric to save your settings.
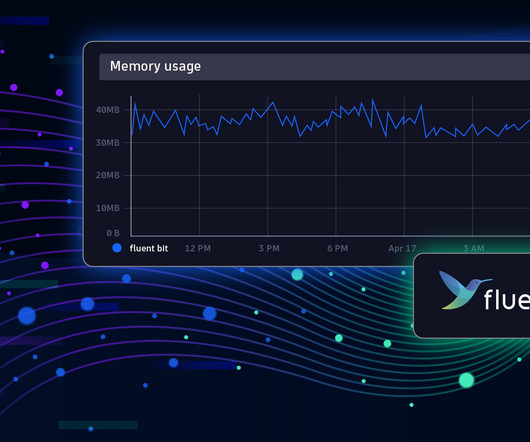
Fluent Bit is a telemetry agent designed to receive data (logs, traces, and metrics), process or modify it, and export it to a destination. Fluent Bit and Fluentd were created for the same purpose: collecting and processing logs, traces, and metrics. Observability: Elevating Logs, Metrics, and Traces! What is Fluent Bit?
To reduce your CloudWatch costs and throttling, you can now select from additional services and metrics to monitor. Get up to 300 new AWS metrics out of the box. Dynatrace ingests AWS CloudWatch metrics for multiple preselected services. Amazon Kinesis Video Streams. Select Add metric to save your settings.
These UA campaigns typically feature static creatives, launch trailers, and game review videos on platforms like Google, Meta, and TikTok. The primary goals of these campaigns are to encourage more people to install and play the games, making incremental installs and engagement crucial metrics for evaluating their effectiveness.
Imagine a ML practitioner on the Netflix Content ML team, sourcing features from hundreds of columns in our data warehouse, and creating a multitude of models against a growing suite of metrics. Take a look at two interesting examples of this pattern in the documentation. Try it athome It couldnt be easier to get started with Configs!Just
Define monitoring goals and user experience metrics Next, define what aspects of a digital experience you want to monitor and improve — such as website performance, application responsiveness, or user engagement — and prioritize what to measure for each application. The time it takes to begin the page’s load event. Load event end.
In fact, for most of us, has become a priority, requiring us to expand our focus on observability to include business analytics metrics. To introduce the video part of this blog, here’s a (short) story about silos; does this one sound familiar? And now, the video…. Is your organization’s story filled with villains or heroes?
by Joel Sole, Mariana Afonso, Lukas Krasula, Zhi Li, and Pulkit Tandon Introducing the banding artifacts detector developed by Netflix aiming at further improving the delivered video quality Banding artifacts can be pretty annoying. Just a subtle change in the video signal can cause banding artifacts. Banding artifact?
If you’re not familiar with Site Reliability Engineering (SRE) and the concepts of Service Level Indicators (SLIs), Service Level Objectives (SLOs) and Service Level Agreements (SLAs) I recommend watching the YouTube Video from Google Engineers called SLIs, SLOs, SLAs, oh my! class SRE implements DevOps) !
Watch the video here, open it on YouTube or watch it on Dynatrace University (including access to slides): If you want to try this yourself then just follow the guidance from Kristof. As mentioned above I encourage you to watch Kristof’s video closely and also download the slides from Dynatrace University. Step 3: SLOs. So – go ahead!
In addition, we provide a unified library that enables ML practitioners to seamlessly access video, audio, image, and various text-based assets. Background Match Cutting is a video editing technique. Step 1 We download a video file and produce shot boundary metadata.
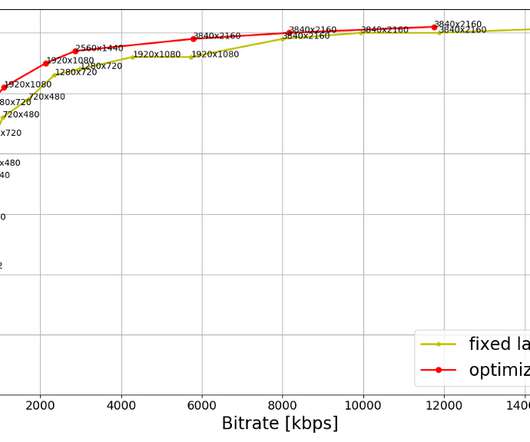
by Liwei Guo , Ashwin Kumar Gopi Valliammal , Raymond Tam , Chris Pham , Agata Opalach , Weibo Ni AV1 is the first high-efficiency video codec format with a royalty-free license from Alliance of Open Media (AOMedia), made possible by wide-ranging industry commitment of expertise and resources. Video encoding is essentially a search problem?—?the
As an example, many retailers already leverage containerized workloads in-store to enhance customer experiences using video analytics or streamline inventory management using RFID tracking for improved security. In this case, Davis finds that a Java Spring Micrometer metric called Failed deliveries is highly correlated with CPU spikes.
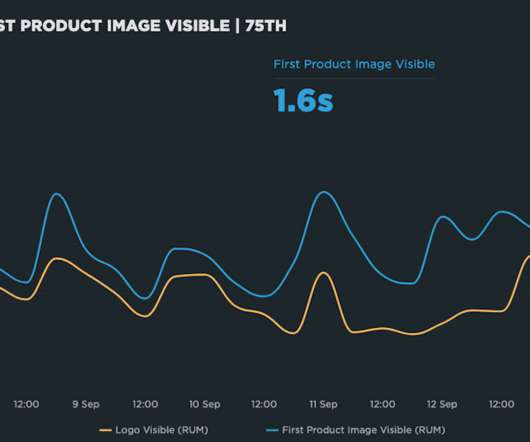
Largest Contentful Paint (LCP) measures when the largest visual element (image or video) finishes rendering. Element Timings can be collected in both Synthetic and RUM by configuring them in the Custom Metrics section of your settings: Adding a custom metric in SpeedCurve. video element's poster image. text nodes.
The ops team understood the concept of business metrics like NPS, conversions rates, even call center volume—but believed these KPIs were meant for other teams. Similarly, IT’s solid SLOs and Apdex scores—important metrics agreed upon by the app owner and IT—were met with a lack of enthusiasm by the business team.
By implementing service-level objectives, teams can avoid collecting and checking a huge amount of metrics for each service. The performance SLO needs a custom SLI metric, which you can configure as follows. Once you define the SLI metric, you can create an SLO based on the number of requests with proper response time.
In part 2, we’ll show you how to retrieve business data from a database, analyze that data using dashboards and ad hoc queries, and then use a Davis analyzer to predict metric behavior and detect behavioral anomalies. Dynatrace users typically use extensions to pull technical monitoring data, such as device metrics, into Dynatrace.
This approach enhances key DORA metrics and enables early detection of failures in the release process, allowing SREs more time for innovation. This blog post explores the Reliability metric , which measures modern operational practices. Why reliability?
>> Scroll down to see predictive capacity management in action (14-second video) Our recent blog post, Stay ahead of the game: Forecast IT capacity with Dynatrace Grail and Davis AI , showed how Dynatrace Notebooks are used to predict the future behavior of time series data stored in Grail™.
Certain SLOs can help organizations get started on measuring and delivering metrics that matter. With this objective, the app ensures that users experience real-time feedback and immediate updates when logging workouts, recording sets and reps, or tracking performance metrics. for the workout video playback feature.
As an example, to render the screen shown here, the app sends a query that looks like this: paths: ["videos", 80154610, "detail"] A path starts from a root object , and is followed by a sequence of keys that we want to retrieve the data for. Instead, it is part of a different path : [videos, <id>, similars].
Watch the video below or read on to learn more about the benefits of an end-to-end platform for mobile app owners. . Out-of-the-box, Dynatrace provides experience metrics using Apdex rating s to illustrate how users are experiencing a particular application. Tracking every mobile user interaction .
We use Python through the full content lifecycle, from deciding which content to fund all the way to operating the CDN that serves the final video to 148 million members. video streaming) takes place in the Open Connect network. We use and contribute to many open-source Python packages, some of which are mentioned below.
We organize all of the trending information in your field so you don't have to. Join 5,000+ users and stay up to date on the latest articles your peers are reading.
You know about us, now we want to get to know you!
Let's personalize your content
Let's get even more personalized
We recognize your account from another site in our network, please click 'Send Email' below to continue with verifying your account and setting a password.


Let's personalize your content