This site uses cookies to improve your experience. To help us insure we adhere to various privacy regulations, please select your country/region of residence. If you do not select a country, we will assume you are from the United States. Select your Cookie Settings or view our Privacy Policy and Terms of Use.
Cookie Settings
Cookies and similar technologies are used on this website for proper function of the website, for tracking performance analytics and for marketing purposes. We and some of our third-party providers may use cookie data for various purposes. Please review the cookie settings below and choose your preference.
Used for the proper function of the website
Used for monitoring website traffic and interactions
Cookie Settings
Cookies and similar technologies are used on this website for proper function of the website, for tracking performance analytics and for marketing purposes. We and some of our third-party providers may use cookie data for various purposes. Please review the cookie settings below and choose your preference.
Strictly Necessary: Used for the proper function of the website
Performance/Analytics: Used for monitoring website traffic and interactions
Migrating Critical Traffic At Scale with No Downtime — Part 1 Shyam Gala , Javier Fernandez-Ivern , Anup Rokkam Pratap , Devang Shah Hundreds of millions of customers tune into Netflix every day, expecting an uninterrupted and immersive streaming experience. This approach has a handful of benefits.
Migrating Critical Traffic At Scale with No Downtime — Part 2 Shyam Gala , Javier Fernandez-Ivern , Anup Rokkam Pratap , Devang Shah Picture yourself enthralled by the latest episode of your beloved Netflix series, delighting in an uninterrupted, high-definition streaming experience. This is where large-scale system migrations come into play.
The emerging concepts of working with DevOps metrics and DevOps KPIs have really come a long way. DevOps metrics to help you meet your DevOps goals. Like any IT or business project, you’ll need to track critical key metrics. Here are nine key DevOps metrics and DevOps KPIs that will help you be successful.
Welcome back to the blog series where we provide you with deep dives into the latest observability awesomeness from Dynatrace , demonstrating how we bring scale, zero configuration, automatic AI driven alerting, and root cause analysis to all your custom metrics, including open source observability frameworks like StatsD, Telegraf, and Prometheus.
The Challenge of Title Launch Observability As engineers, were wired to track system metrics like error rates, latencies, and CPU utilizationbut what about metrics that matter to a titlessuccess? To detect issues proactively, we need to simulate traffic and predict system behavior in advance.
We accomplish this by gathering detailed column-level metrics that offer insights into the state and quality of each impression. These metrics include everything from validating identifiers to checking that essential columns are properly filled. Thus, all data in one region is processed by the Flink job deployed within thatregion.
So, we relied on higher-level metrics-based testing: AB Testing and Sticky Canaries. The control group’s traffic utilized the legacy Falcor stack, while the experiment population leveraged the new GraphQL client and was directed to the GraphQL Shim. The Replay Tester tool samples raw traffic streams from Mantis.
Scaling RabbitMQ ensures your system can handle growing traffic and maintain high performance. Optimizing RabbitMQ performance through strategies such as keeping queues short, enabling lazy queues, and monitoring health checks is essential for maintaining system efficiency and effectively managing high traffic loads.
We thus assigned a priority to each use case and sharded event traffic by routing to priority-specific queues and the corresponding event processing clusters. This separation allows us to tune system configuration and scaling policies independently for different event priorities and traffic patterns.
Optimizing RabbitMQ requires clustering, queue management, and resource tuning to maintain stability and efficiency. However, performance can decline under high traffic conditions. It also provides an HTTP API for retrieving performance metrics and a command-line tool for advanced management tasks.
For instance, consider how fine-tuned failure rate detection can provide insights for comprehensive understanding. Please refer to How to fine-tune failure detection (dynatrace.com) for further information. SLOs must be evaluated at 100%, even when there is currently no traffic. What characterizes a weak SLO?
A metric crossed a threshold. You’re half awake and wondering, “Is there really a problem or is this just an alert that needs tuning? Telltale learns what constitutes typical health for an application, no alert tuning required. Metrics are a key part of understanding application health. Regional traffic evacuations.
Unnecessary traffic between such data centers can result in wasted resources, unpredictable downtimes, and lost business. By minimizing bandwidth and preventing unrelated traffic between data centers, you can maintain healthy network infrastructure and save on costs. optimizing traffic routing. What’s next.
How viewers are able to watch their favorite show on Netflix while the infrastructure self-recovers from a system failure By Manuel Correa , Arthur Gonigberg , and Daniel West Getting stuck in traffic is one of the most frustrating experiences for drivers around the world. Logs and background requests are examples of this type of traffic.
Open-source metric sources automatically map to our Smartscape model for AI analytics. We’ve just enhanced Dynatrace OneAgent with an open metric API. Here’s a quick overview of what you can achieve now that the Dynatrace Software Intelligence Platform has been extended to ingest third-party metrics. Dynatrace news.
Dynatrace is fully committed to the OpenTelemetry community and to the seamless integration of OpenTelemetry data , including ingestion of custom metrics , into the Dynatrace open analytics platform. With Dynatrace OneAgent you also benefit from support for traffic routing and traffic control. What’s next?
This opens the door to auto-scalable applications, which effortlessly matches the demands of rapidly growing and varying user traffic. For a deeper look into how to gain end-to-end observability into Kubernetes environments, tune into the on-demand webinar Harness the Power of Kubernetes Observability. What is Docker? Networking.
Automatic collection of the entire set of services that publish metrics to Amazon CloudWatch. these metrics are also automatically analyzed by Dynatrace’s AI engine, Davis ). Dynatrace as a managed AWS workload, and as an option, have the network traffic to Dynatrace run over PrivateLink so that traffic never leaves AWS.
For example, to handle traffic spikes and pay only for what they use. Scale automatically based on the demand and traffic patterns. Observability is typically achieved by collecting three types of data from a system, metrics, logs and traces. The elasticity of serverless services helps organizations scale as needed.
264/AVC Main profile family still represents a substantial portion of the members viewing hours and an even larger portion of the traffic. These are summarized below: Instead of relying on other objective metrics, such as PSNR†, VMAF is employed to guide optimization decisions. Further tuning of pre-defined encoding parameters.
Fast, consistent application delivery creates a positive user experience that can ultimately drive customer loyalty and improve business metrics like conversion rate and user retention. It is proactive monitoring that simulates traffic with established test variables, including location, browser, network, and device type.
However, understanding the performance of different application types requires an emphasis on different performance metrics, that is, key performance metrics. For many traditional web applications , User action duration is considered the best metric available for web-performance optimization.
Host performance is tracked via high-level health metrics on the home dashboard to details for each of the hosts. For details on available metrics, see our help page on host performance monitoring. Network metrics are also collected for detected processes. Disk metrics are collected for each discovered disk.
While the first guardian validates the traffic, the second guardian checks the business transactions generated during the observation period. In this case, the four golden signals (latency, traffic, errors, and saturation) are derived from span attributes and DQL metric queries via Dynatrace Grail™.
The short answer: The three pillars of observability—logs, metrics, and traces—converging on a data lakehouse. You’re getting all the architectural benefits of Grail—the petabytes, the cardinality—with this implementation,” including the three pillars of observability: logs, metrics, and traces in context.
Dynatrace Synthetic Monitoring helps you quickly verify if your application is delivering the expected end user experience by offering an outside-in view of all your applications and services, independent of real traffic. So stay tuned! Automated SLA/SLO monitoring using the HTTP monitoring API.
You will need to know which monitoring metrics for Redis to watch and a tool to monitor these critical server metrics to ensure its health. Redis returns a big list of database metrics when you run the info command on the Redis shell. You can pick a smart selection of relevant metrics from these.
Making applications observable—relying on metrics, logs, and traces to understand what software is doing and how it’s performing—has become increasingly important as workloads are shifting to multicloud environments. We also introduced our demo app and explained how to define the metrics and traces it uses.
Host performance is tracked via high-level health metrics with details for each host (these appear on your home dashboard by default). For details on available metrics, see host performance monitoring. Network metrics are also collected for detected processes. Disk metrics are collected for each discovered disk.
Host performance is tracked via high-level health metrics on the home dashboard to details for each of the hosts. For details on available metrics, see our help page on host performance monitoring. Network metrics are also collected for detected processes. Disk metrics are collected for each discovered disk.
This capability provides version information along with an additional insight into traffic and problems per version. This enables you to easily make use of the more than 2,000 out of the box metrics provided by Dynatrace as well as bringing in your custom metrics and data ingest. What’s next.
We do not use it for metrics, histograms, timers, or any such near-real time analytics use case. Handling Bursty Traffic : Managing significant traffic spikes during high-demand events, such as new content launches or regional failovers. Those use cases are well served by the Netflix Atlas telemetry system.
Demand Engineering Demand Engineering is responsible for Regional Failovers , Traffic Distribution, Capacity Operations and Fleet Efficiency of the Netflix cloud. One example is the Spectator Python client library, a library for instrumenting code to record dimensional time series metrics.
Observability data provides a treasure trove of performance, stability, and user experience metrics encompassing error rates, response times, and user engagement. With swift precision, an answer-driven automation solution that uses causal AI can transform these metrics into invaluable insights.
Which metrics are relevant for your business, anyway? Modern observability tools provide many metrics, but which ones are really important for your business? Dynatrace offers more than 2000 different metrics that are ready for use as dedicated SLIs. Read more about the basics of Site Reliability Engineering below.).
The seamless integration enables enrichment of your OpenTelemetry metrics and traces with insights from the Dynatrace Software Intelligence Platform. Well-defined metrics for your applications and microservices should also be at the heart of your technical analysis. So please stay tuned for updates.
For instance, when there isn’t enough traffic (late at night), the AI will not act to avoid alert spamming. It doesn’t apply to infrastructure metrics such as CPU or memory. If you want to understand how Dynatrace detects errors, read my other blog on how to fine-tune it ! This is called a frequent issue.
Canary Test Workloads In addition to serving the regular message traffic between users and DUTs, the control plane itself is stress-tested at roughly 3-hour intervals, where nearly 3000 ephemeral MQTT clients are created to connect to and generate flash traffic on the MQTT brokers.
In particular, the VMAF metric lies at the core of improving the Netflix member’s streaming video quality. The request provides the source and the derivative whose quality is to be computed and requests that the VQS provides quality scores using VMAF, PSNR and SSIM as quality metrics. Assembly for two of the metrics (e.g.
We took a hybrid head-based sampling approach that allows for recording 100% of traces for a specific and configurable set of requests, while continuing to randomly sample traffic per the policy set at ingestion point.
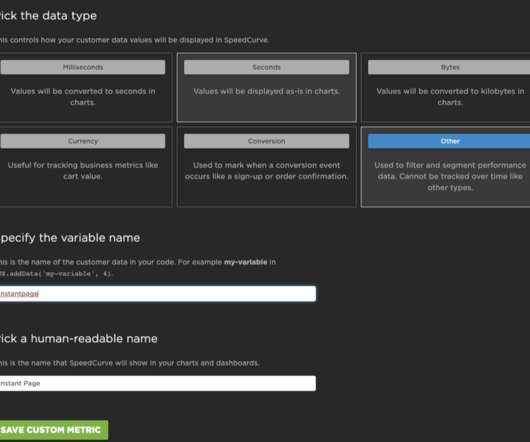
By serving one version of the site with instant.page in place to some traffic, and a site without it to another, I could compare the performance of them both over the same timespan and see how it shakes out. It would have only taken moments in SpeedCurve to see live traffic come through, but I’m an impatient person.
While there is no magic bullet for MySQL performance tuning, there are a few areas that can be focused on upfront that can dramatically improve the performance of your MySQL installation. What are the Benefits of MySQL Performance Tuning? A finely tuned database processes queries more efficiently, leading to swifter results.
Data Quality Data Mesh provides metrics and dashboards at both the processor and pipeline level for operational observability. It is generating heartbeat signals at a constant frequency with the objective of using them as a baseline to verify the health of the pipeline regardless of traffic patterns or occasional silences.
The key insight was that by assuming a latent Gaussian Process (GP) prior on the key business metric actions like viral engagement, job applications, etc., And finally each new observation needs to update the policy, compute offline policy evaluation metrics and then push the policy back to production so it can generate new intents to treat.
We organize all of the trending information in your field so you don't have to. Join 5,000+ users and stay up to date on the latest articles your peers are reading.
You know about us, now we want to get to know you!
Let's personalize your content
Let's get even more personalized
We recognize your account from another site in our network, please click 'Send Email' below to continue with verifying your account and setting a password.


Let's personalize your content