This site uses cookies to improve your experience. To help us insure we adhere to various privacy regulations, please select your country/region of residence. If you do not select a country, we will assume you are from the United States. Select your Cookie Settings or view our Privacy Policy and Terms of Use.
Cookie Settings
Cookies and similar technologies are used on this website for proper function of the website, for tracking performance analytics and for marketing purposes. We and some of our third-party providers may use cookie data for various purposes. Please review the cookie settings below and choose your preference.
Used for the proper function of the website
Used for monitoring website traffic and interactions
Cookie Settings
Cookies and similar technologies are used on this website for proper function of the website, for tracking performance analytics and for marketing purposes. We and some of our third-party providers may use cookie data for various purposes. Please review the cookie settings below and choose your preference.
Strictly Necessary: Used for the proper function of the website
Performance/Analytics: Used for monitoring website traffic and interactions
Migrating Critical Traffic At Scale with No Downtime — Part 1 Shyam Gala , Javier Fernandez-Ivern , Anup Rokkam Pratap , Devang Shah Hundreds of millions of customers tune into Netflix every day, expecting an uninterrupted and immersive streaming experience. This approach has a handful of benefits.
Migrating Critical Traffic At Scale with No Downtime — Part 2 Shyam Gala , Javier Fernandez-Ivern , Anup Rokkam Pratap , Devang Shah Picture yourself enthralled by the latest episode of your beloved Netflix series, delighting in an uninterrupted, high-definition streaming experience. This is where large-scale system migrations come into play.
The emerging concepts of working with DevOps metrics and DevOps KPIs have really come a long way. DevOps metrics to help you meet your DevOps goals. Like any IT or business project, you’ll need to track critical key metrics. Here are nine key DevOps metrics and DevOps KPIs that will help you be successful.
The Carbon Impact app directly supports our customers sustainability efforts through granular real-time emissions reporting and analytics, translating host utilization metrics into their CO2 equivalent (CO2e). We implemented a wasted energy metric in the app to enhance practitioner actionability. Public network traffic uses 1.0
The three strategies we will discuss today are AB Testing , Replay Testing, and Sticky Canaries. To launch Phase 1 safely, we used AB Testing. To launch Phase 2 safely, we used Replay Testing and Sticky Canaries. We knew we could test the same query with the same inputs and consistently expect the same results.
To do this, we devised a novel way to simulate the projected traffic weeks ahead of launch by building upon the traffic migration framework described here. New content or national events may drive brief spikes, but, by and large, traffic is usually smoothly increasing or decreasing.
A website needs to be constantly tested and optimized to be in line with Google's web and SEO guidelines. As a result, it has an advantage over others in terms of visibility, brand image, and driving traffic. This article will learn about web performance testing and how Core Web Vitals plays a crucial and strategic part in it.
Synthetic testing simulates real-user behaviors within an application or service to pinpoint potential problems. Here’s a look at why this testing matters, how it works, and what companies need to get the most from this approach. What is synthetic testing? RUM, meanwhile, requires actual users.
How viewers are able to watch their favorite show on Netflix while the infrastructure self-recovers from a system failure By Manuel Correa , Arthur Gonigberg , and Daniel West Getting stuck in traffic is one of the most frustrating experiences for drivers around the world. Logs and background requests are examples of this type of traffic.
Automating quality gates is ideal, as it minimizes manually checking and validating key metrics throughout the SDLC. By actively monitoring metrics such as error rate, success rate, and CPU load, quality gates instill confidence in teams during software releases. Several tools can be used to collect metrics in load/performance testing.
These development and testing practices ensure the performance of critical applications and resources to deliver loyalty-building user experiences. RUM gathers information on a variety of performance metrics. RUM is ideally suited to provide real metrics from real users navigating a site or application.
This becomes even more challenging when the application receives heavy traffic, because a single microservice might become overwhelmed if it receives too many requests too quickly. The Envoy proxies also collect and report telemetry on all traffic among the services in the mesh. Why do you need a service mesh?
The time and effort saved with testing and deployment are a game-changer for DevOps. This opens the door to auto-scalable applications, which effortlessly matches the demands of rapidly growing and varying user traffic. Containers can be replicated or deleted on the fly to meet varying end-user traffic. What is Docker?
When the SLO status converges to an optimal value of 100%, and there’s substantial traffic (calls/min), BurnRate becomes more relevant for anomaly detection. Error budget burn rate = Error Rate / (1 – Target) Best practices in SLO configuration To detect if an entity is a good candidate for strong SLO, test your SLO.
Certain SLOs can help organizations get started on measuring and delivering metrics that matter. With this objective, the app ensures that users experience real-time feedback and immediate updates when logging workouts, recording sets and reps, or tracking performance metrics. The Apdex score of 0.85
After a new build gets deployed and automated tests executed, SLIs are evaluated against their SLOs and, depending on that result, a build is considered good (promoted) or bad (rolled back). “ The app description and supporting files such as load testing scripts are on the Keptn Example GitHub. This is what this blog is all about.
By implementing service-level objectives, teams can avoid collecting and checking a huge amount of metrics for each service. Stable, well-calibrated SLOs pave the way for teams to automate additional processes and testing throughout the software delivery lifecycle. SLOs promote automation. SLOs minimize downtime.
Organizations can now accelerate innovation and reduce the risk of failed software releases by incorporating on-demand synthetic monitoring as a metrics provider for automatic, continuous release-validation processes. The ability to scale testing as part of the software development lifecycle (SDLC) has proven difficult.
Validation tasks are then extended left to cover performance testing and release validation in a pre-production environment. While the first guardian validates the traffic, the second guardian checks the business transactions generated during the observation period. The functionality is implemented via an automated workflow.
To prepare ourselves for a big change in the tech stack of our endpoint, we decided to track metrics around the time taken to respond to queries. After some consultation with our backend teams, we determined the most effective way to group these metrics were by UI screen. For the migration, testing was a first-class citizen.
Here we describe the role of Experimentation and A/B testing within the larger Data Science and Engineering organization at Netflix, including how our platform investments support running tests at scale while enabling innovation. What more can we learn from this test, to inform the next one?”
At Netflix, we have significant investments in ensuring new versions of our applications are well tested. However, Netflix is available for streaming on thousands of types of devices and it is powered by hundreds of micro-services which are deployed independently, making it extremely challenging to comprehensively test internally.
Fast, consistent application delivery creates a positive user experience that can ultimately drive customer loyalty and improve business metrics like conversion rate and user retention. It is proactive monitoring that simulates traffic with established test variables, including location, browser, network, and device type.
SREs face ever more challenging situations as environment complexity increases, applications scale up, and organizations grow: Growing dependency graphs result in blind spots and the inability to correlate performance metrics with user experience. Additionally, you can easily use any previously defined metrics and SLOs from your environments.
264/AVC Main profile family still represents a substantial portion of the members viewing hours and an even larger portion of the traffic. These are summarized below: Instead of relying on other objective metrics, such as PSNR†, VMAF is employed to guide optimization decisions. Yet, given its wide support, our H.264/AVC
It’s the same concept as Test Driven Development (TDD) where you start with tests that will fail until you finish implementing the code so tests will succeed. In the workshop, I also answered the question: How can we measure those metrics (=SLIs) that are behind our objectives? In Dynatrace that’s easy: App Adoption Rate.
Turnkey cluster overload protection with adaptive traffic management and control. This can occur especially when: There are temporary load spikes due to peak loads from monitored applications that are being load tested, or from cluster nodes that are taking over load from others that are under maintenance or being upgraded.
Dynatrace captures and provides organizations with the precursors of intent; dependencies, performance metrics, and prioritization which helps solve each organizations’ spontaneous production workload puzzle. Performance Metrics. Dependencies.
By Benson Ma , Alok Ahuja Introduction At Netflix, hundreds of different device types, from streaming sticks to smart TVs, are tested every day through automation to ensure that new software releases continue to deliver the quality of the Netflix experience that our customers enjoy. In this blog post, we will focus on the latter feature set.
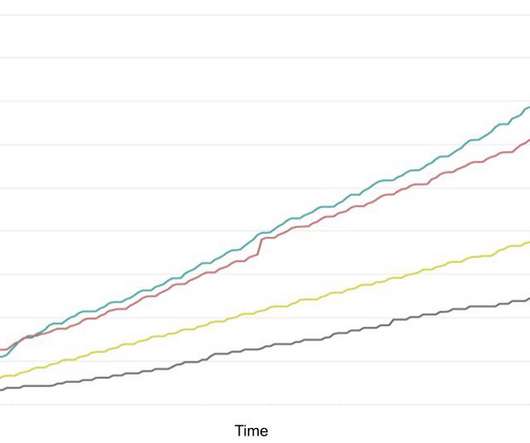
A vital aspect of such development is subjective testing with HDR encodes in order to generate training data. The pandemic, however, posed unique challenges in conducting a conventional in-lab subjective test with HDR encodes. 1) depicts the migration of traffic from fixed bitrates to DO encodes. The graphic below (Fig.
By deploying a new version of your app into a staging environment, you can easily test it before it goes live. Receive alerts for any custom metric events in your Azure Deployment Slots . You can even redirect part of your production traffic to the staging slot in order to test the new version on a limited number of real users.
You will need to know which monitoring metrics for Redis to watch and a tool to monitor these critical server metrics to ensure its health. Redis returns a big list of database metrics when you run the info command on the Redis shell. You can pick a smart selection of relevant metrics from these.
Each tenant gets its own e-commerce site deployed on a shared Kubernetes cluster, isolated through separate namespaces and additional traffic isolation. There was not much traffic during the weekend, but as Monday came along, Dynatrace started sending alerts about a high HTTP failure rate across almost every tenant on the backend service.
Early warning indicators Dynatrace provides metrics including service-level objectives (SLOs) and service-level indicators (SLIs) that allow teams to predict problems before they occur and especially before they impact customers. The post Taming DORA compliance with AI, observability, and security appeared first on Dynatrace news.
Demand Engineering Demand Engineering is responsible for Regional Failovers , Traffic Distribution, Capacity Operations and Fleet Efficiency of the Netflix cloud. One example is the Spectator Python client library, a library for instrumenting code to record dimensional time series metrics.
The State Of Mobile And Why Mobile Web Testing Matters. The State Of Mobile And Why Mobile Web Testing Matters. These days, with mobile traffic accounting for over 50% of web traffic , it’s fair to assume that the very first encounter of your prospect customers with your brand will happen on a mobile device.
Client-side A/B testing has been a performance loving developer’s worst friend for years. From a convenience perspective, running client-side tests is significantly easier to do than server-side testing. With server-side testing, you need developer resources to create different experiments.
Dynatrace offers various out-of-the-box features and applications to provide a high-density overview of system health for all hosts and related metrics in a single view. Foundation and Discovery provide essential metrics and topology discovery, making it useful to quickly identify and recover affected hosts.
The initial release of the solution with OneAgent version 1.173 is certified and tested to work on RedHat Enterprise Linux (RHEL) distribution 6.9+ Host performance is tracked via high-level health metrics on the home dashboard to details for each of the hosts. Network metrics are also collected for detected processes.
It was a great excuse for running a split test. By serving one version of the site with instant.page in place to some traffic, and a site without it to another, I could compare the performance of them both over the same timespan and see how it shakes out. All that was left was to see if the split testing was actually working.
All Core Web Vitals data used to rank you is taken from actual Chrome-based traffic to your site. The Core Web Vitals Metrics Generally, I approve of the Core Web Vitals metrics themselves ( Largest Contentful Paint , First Input Delay , Cumulative Layout Shift , and the nascent Interaction to Next Paint ).
Certain service-level objective examples can help organizations get started on measuring and delivering metrics that matter. With this objective, the app ensures that users experience real-time feedback and immediate updates when logging workouts, recording sets and reps, or tracking performance metrics. The Apdex score of 0.85
There are three metrics that are hit hard by slow page load times: Abandonment rate Revenue Brand health Let’s take a deeper dive into the data behind each of these metrics. Participants believed they were participating in a standard usability/brand perception study, so they had no idea that speed was a factor in the tests.
Dynatrace Cloud Automation allows easy analysis of the status and impact a release has on your business or on test results in any environment. This capability provides version information along with an additional insight into traffic and problems per version.
We organize all of the trending information in your field so you don't have to. Join 5,000+ users and stay up to date on the latest articles your peers are reading.
You know about us, now we want to get to know you!
Let's personalize your content
Let's get even more personalized
We recognize your account from another site in our network, please click 'Send Email' below to continue with verifying your account and setting a password.


Let's personalize your content