This site uses cookies to improve your experience. To help us insure we adhere to various privacy regulations, please select your country/region of residence. If you do not select a country, we will assume you are from the United States. Select your Cookie Settings or view our Privacy Policy and Terms of Use.
Cookie Settings
Cookies and similar technologies are used on this website for proper function of the website, for tracking performance analytics and for marketing purposes. We and some of our third-party providers may use cookie data for various purposes. Please review the cookie settings below and choose your preference.
Used for the proper function of the website
Used for monitoring website traffic and interactions
Cookie Settings
Cookies and similar technologies are used on this website for proper function of the website, for tracking performance analytics and for marketing purposes. We and some of our third-party providers may use cookie data for various purposes. Please review the cookie settings below and choose your preference.
Strictly Necessary: Used for the proper function of the website
Performance/Analytics: Used for monitoring website traffic and interactions
Break data silos and add context for faster, more strategic decisions : Unifying metrics, logs, traces, and user behavior within a single platform enables real-time decisions rooted in full context, not guesswork. Such an approach is in line with my personal mantra and Dynatrace founding principle: reduce to the max.
Adopting AI to enhance efficiency and boost productivity is critical in a time of exploding data, cloud complexities, and disparate technologies. Dynatrace delivers AI-powered, data-driven insights and intelligent automation for cloud-native technologies including Azure.
As organizations adopt more cloud-native technologies, the risk—and consequences—of cyberattacks are also increasing. Through this integration, Dynatrace enriches data collected by Microsoft Sentinel to provide organizations with enhanced data insights in context of their full technology stack.
In IT and cloud computing, observability is the ability to measure a system’s current state based on the data it generates, such as logs, metrics, and traces. If you’ve read about observability, you likely know that collecting the measurements of logs, metrics, and distributed traces are the three key pillars to achieving success.
We’re proud to announce that Ally Financial has presented Dynatrace with its Ally Technology Velocity with Quality award. This is the second time Ally Financial has presented its Ally Technology Partner Awards. Ally Financial is the home of the nation’s largest all-digital bank and is an industry-leading auto financing business.
Building on its advanced analytics capabilities for Prometheus data , Dynatrace now enables you to create extensions based on Prometheus metrics. This allows teams to extend the intelligent observability Dynatrace provides to all technologies that provide Prometheus exporters. Our monitoring coverage already includes ?
With so many types of technologies in software stacks around the globe, OpenTelemetry has emerged as the de facto standard for gathering telemetry data. Semconv for HTTP Spans quite possibly the most important signal have been declared stable, and HTTP Metrics will hopefully soon follow.
Dynatrace has recently extended its Kubernetes operator by adding a new feature, the Prometheus OpenMetrics Ingest , which enables you to import Prometheus metrics in Dynatrace and build SLO and anomaly detection dashboards with Prometheus data. Here we’ll explore how to collect Prometheus metrics and what you can achieve with them.
Indeed, around 85% of technology leaders believe their problems are compounded by the number of tools, platforms, dashboards, and applications they rely on to manage multicloud environments. It also helps to have access to OpenTelemetry, a collection of tools for examining applications that export metrics, logs, and traces for analysis.
As a technology executive, you’re aware that observability has become an imperative for managing the health of cloud and IT services. However, technology executives face a significant challenge getting answers in time, as their needs have evolved to real-time business insights that enable faster decision-making and business automation.
Every company has its own strategy as to which technologies to use. To remain flexible in observing all technologies used in their organization, some companies choose open-source solutions, which allow them to stay vendor-neutral. Micrometer is used for instrumenting both out-of-the-box and custom metrics from Spring Boot applications.
Dynatrace OpenPipeline is a new stream processing technology that ingests and contextualizes data from any source. For years, logs have been the dominant approach many observability vendors have taken to report business metrics on dashboards. Business event ingestion and analysis with log files.
DataJunction: Unifying Experimentation and Analytics Yian Shang , AnhLe At Netflix, like in many organizations, creating and using metrics is often more complex than it should be. DJ acts as a central store where metric definitions can live and evolve. As an example, imagine an analyst wanting to create a Total Streaming Hours metric.
already address SNMP, WMI, SQL databases, and Prometheus technologies, serving the monitoring needs of hundreds of Dynatrace customers. are technologically very different, Python and JMX extensions designed for Extension Framework 1.0 Extensions can monitor virtually any type of technology in your environment. Extensions 2.0
Technology and business leaders express increasing interest in integrating business data into their IT observability strategies, citing the value of effective collaboration between business and IT. Metric extraction is a convenient way to create your business metrics, delivering fast, flexible, and cost-effective analytics.
Google Cloud Ready – AlloyDB is a new designation for the solutions of Google Cloud’s technology partners that integrate with AlloyDB. With this Google Cloud Ready integration, Dynatrace ensures that AlloyDB for PostgreSQL users can now ingest metrics along with existing Google Cloud data.
This massive migration is critical to organizations’ digital transformation , placing cloud technology front and center and elevating the need for greater visibility, efficiency, and scalability delivered by a unified observability and security platform. Thoughtful reinvestment. Observability with AI and automation.
Now, Dynatrace has the ability to turn numerical values from logs into metrics, which unlocks AI-powered answers, context, and automation for your apps and infrastructure, at scale. This also applies to logging use cases for certain technologies. Manual tracking of metrics from logs is too complex at scale.
To get a more granular look into telemetry data, many analysts rely on custom metrics using Prometheus. Named after the Greek god who brought fire down from Mount Olympus, Prometheus metrics have been transforming observability since the project’s inception in 2012.
These are two values he shares with DevOps activist Andreas Grabner, who sat down with Hightower at Dynatrace Perform 2022 to talk about taming Kubernetes and the future of cloud-native technologies. If you’re going to have an SLO, you should have a story in mind of why you’re setting up all these alerts and collecting all these metrics.
The five key metrics to improve customer satisfaction To help turn this around, Dynatrace makes available its unified observability platform, which captures all CX interactions and transactions in an automated, intelligent manner – including user session replays. When combined, key metrics will generate an accurate CX index score.
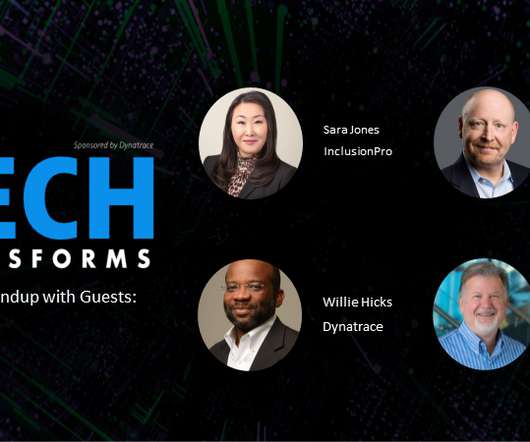
We also explore how to improve user experiences within the Zero Trust framework and how to develop security metrics that eliminate DevSecOps bottlenecks. Our lineup of top influencers in government technology in June includes the following: Sara Jones – CEO at InclusionPro. Bob Stevens – AVP, Public Sector at GitLab.
I realized that our platforms unique ability to contextualize security events, metrics, logs, traces, and user behavior could revolutionize the security domain by converging observability and security. Collect observability and security data user behavior, metrics, events, logs, traces (UMELT) once, store it together and analyze in context.
The Dynatrace platform automatically captures and maps metrics, logs, traces, events, user experience data, and security signals into a single datastore, performing contextual analytics through a “power of three AI”—combining causal, predictive, and generative AI. It’s about uncovering insights that move business forward.
It collects, processes, and outputs log files to and from a wide variety of technologies. All metrics, traces, and real user data are also surfaced in the context of specific events. With Dynatrace, you can create custom metrics based on user-defined log events. So, let’s compare the two approaches for ingesting logs.
In January and February, we spoke with a couple of the top influencers in government technology, including Jamie Holcombe , Chief Information Officer at the United State Patent and Trademark Office [USPTO]; and Dimitris Perdikou , Head of Engineering at the UK Home Office, Migration and Borders.
That is, relying on metrics, logs, and traces to understand what software is doing and where it’s running into snags. In addition to tracing, observability also defines two other key concepts, metrics and logs. When software runs in a monolithic stack on on-site servers, observability is manageable enough. What is OpenTelemetry?
The Carbon Impact app directly supports our customers sustainability efforts through granular real-time emissions reporting and analytics, translating host utilization metrics into their CO2 equivalent (CO2e). We implemented a wasted energy metric in the app to enhance practitioner actionability.
With the development in technology, the software gets upgraded with the latest updates. As the technological world evolves, so do user expectations for handling applications; it is essential to test the performance of the applications before deploying them on a large scale.
The configuration also includes an optional span metrics connector, which generates Request, Error, and Duration (R.E.D.) metrics from span data. The configuration also includes an optional span metrics connector, which generates Request, Error, and Duration (R.E.D.) metrics from span data.
Thousands of new technologies are created and integrated with Dynatrace products every day. You usually know precisely what you need regarding monitoring and which technologies and services you want to monitor. Each technology might be monitored differently. Extensions bring you a load of metrics.
With over 700 ready-made apps and integrations on the Hub, Dynatrace seamlessly automates full stack monitoring, ensuring comprehensive coverage regardless of the technologies you’re utilizing. Search the Hub to find Extensions for effortlessly importing technology-specific metrics. Of course, seeing is believing.
Amazon Bedrock , equipped with Dynatrace Davis AI and LLM observability , gives you end-to-end insight into the Generative AI stack, from code-level visibility and performance metrics to GenAI-specific guardrails. Send unified data to Dynatrace for analysis alongside your logs, metrics, and traces.
Additionally, emerging technologies like artificial intelligence and blockchain have given a competitive edge to enterprises. The following list is prepared after considering metrics like recent trends, language popularity, career prospects, open-source projects, and more. Which Automation Programming Language Is the Best for Testing?
The improved configuration workflow for custom event alerting offers a lot of power in terms of defining additional metric-based events for your Dynatrace environment. detects suspicious metric behavior by analyzing the value distribution of metrics. Understand complex issues instantly with new root-cause analysis capabilities.
The primary goals of these campaigns are to encourage more people to install and play the games, making incremental installs and engagement crucial metrics for evaluating their effectiveness. Leveraging technologies like Assistive Speech Recognition (ASR), we seek to make the transcription part of the process more efficient for our linguists.
Dynatrace captures all your data, including host and application metrics, basic-network metrics, real-user metrics, mobile metrics, cloud-infrastructure metrics, log metrics, and much more. Security: Data is stored securely in the Dynatrace cloud (powered by Azure).
In the dynamic world of technology, its tempting to leap into problem-solving mode. Title Health encompasses various metrics and indicators that reflect how well a title is performing, in terms of discoverability and member engagement. How do we ensure every title launches seamlessly and remains discoverable by the right audience?
Telemetry data, such as traces and metrics, allow you to analyze the end-to-end performance of your deployed applications. You also benefit from enhanced monitoring capabilities with seamless Dynatrace integrations with cloud-native technologies and services like Istio and Prometheus.
From a cost perspective, internal customers waste valuable time sending tickets to operations teams asking for metrics, logs, and traces to be enabled. A team looking for metrics, traces, and logs no longer needs to file a ticket to get their app monitored in their own environments. This approach is costly and error prone.
In today’s Information Technology (IT) digital transformation world, many applications are getting hosted in cloud environments every day. Monitoring and maintaining these applications daily is very challenging and we need proper metrics in place to measure and take action. Defining SLA, SLO, SLI, and SRE What Is an SLA?
Now, with technology-specific views, DevOps teams can see messaging system-related anomalies, which significantly simplifies troubleshooting efforts. With other products, we had to make guesses about the impacted services based solely on metrics”. Easily troubleshoot anomalies with technology-specific views. This is great!
Full integration with existing Dynatrace capabilities for AWS Lambda (for example, metric ingestion via AWS Cloud Watch). Fully integrated with existing Dynatrace capabilities for AWS Lambda, including metric ingestion via AWS Cloud Watch. You can easily find Lambda functions on this page by filtering for Technology: AWS Lambda.
In the dynamic world of cloud-native technologies, monitoring and observability have become indispensable. By collecting and analyzing metrics in real-time, it enables teams to proactively identify and resolve issues before they impact users. Kubernetes, the de-facto orchestration platform, offers scalability and agility.
We organize all of the trending information in your field so you don't have to. Join 5,000+ users and stay up to date on the latest articles your peers are reading.
You know about us, now we want to get to know you!
Let's personalize your content
Let's get even more personalized
We recognize your account from another site in our network, please click 'Send Email' below to continue with verifying your account and setting a password.


Let's personalize your content