This site uses cookies to improve your experience. To help us insure we adhere to various privacy regulations, please select your country/region of residence. If you do not select a country, we will assume you are from the United States. Select your Cookie Settings or view our Privacy Policy and Terms of Use.
Cookie Settings
Cookies and similar technologies are used on this website for proper function of the website, for tracking performance analytics and for marketing purposes. We and some of our third-party providers may use cookie data for various purposes. Please review the cookie settings below and choose your preference.
Used for the proper function of the website
Used for monitoring website traffic and interactions
Cookie Settings
Cookies and similar technologies are used on this website for proper function of the website, for tracking performance analytics and for marketing purposes. We and some of our third-party providers may use cookie data for various purposes. Please review the cookie settings below and choose your preference.
Strictly Necessary: Used for the proper function of the website
Performance/Analytics: Used for monitoring website traffic and interactions
In IT and cloud computing, observability is the ability to measure a system’s current state based on the data it generates, such as logs, metrics, and traces. An advanced observability solution can also be used to automate more processes, increasing efficiency and innovation among Ops and Apps teams. What is observability?
The business process observability challenge Increasingly dynamic business conditions demand business agility; reacting to a supply chain disruption and optimizing order fulfillment are simple but illustrative examples. Most business processes are not monitored. First and foremost, it’s a data problem.
With the most important components becoming release candidates , Dynatrace now supports the full OpenTelemetry specification on all runtimes and automatically adds intelligence to metrics at enterprise scale. So these metrics are immensely valuable to SRE and DevOps teams. Automation and intelligence for metrics at enterprise scale.
A Data Movement and Processing Platform @ Netflix By Bo Lei , Guilherme Pires , James Shao , Kasturi Chatterjee , Sujay Jain , Vlad Sydorenko Background Realtime processing technologies (A.K.A stream processing) is one of the key factors that enable Netflix to maintain its leading position in the competition of entertaining our users.
In a previous article , we explained how we built benchmarks to keep track of those three metrics: precision, recall, and the most important here, speed. At roughly 10 thousand public documents scanned every minute , this eventually led to a bottleneck.
Early this year, the book Software Architecture Metrics: Case Studies to Improve the Quality of Your Architecture was published. Intro and Problem Statement. Christian Ciceri, co-founder and chief architect for Apiumhub, is one of the co-authors.
One of the more popular use cases is monitoring business processes, the structured steps that produce a product or service designed to fulfill organizational objectives. By treating processes as assets with measurable key performance indicators (KPIs), business process monitoring helps IT and business teams align toward shared business goals.
This is achieved, in part, by establishing actionable statistical accuracy —not necessarily precise accuracy —through practical levels of metric sampling, aggregation, and extrapolation. Introducing metric extraction from business events Beginning with Dynatrace SaaS version 1.257, you can extract metrics from ingested business events.
Unrealized optimization potential of business processes due to monitoring gaps Imagine a retail company facing gaps in its business process monitoring due to disparate data sources. Due to separated systems that handle different parts of the process, the view of the process is fragmented.
by Jun He , Yingyi Zhang , and Pawan Dixit Incremental processing is an approach to process new or changed data in workflows. The key advantage is that it only incrementally processes data that are newly added or updated to a dataset, instead of re-processing the complete dataset.
The five key metrics to improve customer satisfaction To help turn this around, Dynatrace makes available its unified observability platform, which captures all CX interactions and transactions in an automated, intelligent manner – including user session replays. When combined, key metrics will generate an accurate CX index score.
In an attempt to hold their place within the market, developers are having to speed their process up whilst delivering products of ever-increasing quality. In 2019, according to Evans Data Corporation, there were 23.9 million developers worldwide. This happening all across the board, even and especially at the 50 leading SaaS companies.
To get a more granular look into telemetry data, many analysts rely on custom metrics using Prometheus. Named after the Greek god who brought fire down from Mount Olympus, Prometheus metrics have been transforming observability since the project’s inception in 2012.
But this process usually takes a couple of weeks. The responsibility of developers keeps growing, and as mobile apps get more complex, new tools for mobile performance monitoring and testing are being born. During that time, users can get frustrated with performance issues making them more likely to leave a bad review in the app store.
Development of any software is a tedious and long process, and it undergoes a series of quality and performance tests before its release and use. There are several software products on the market that are used for their varied applications. This software makes the different tasks easier and allows for increased efficiency and performance.
Organizations choose data-driven approaches to maximize the value of their data, achieve better business outcomes, and realize cost savings by improving their products, services, and processes. Data is then dynamically routed into pipelines for further processing. Understanding the context.
That is, relying on metrics, logs, and traces to understand what software is doing and where it’s running into snags. In addition to tracing, observability also defines two other key concepts, metrics and logs. When software runs in a monolithic stack on on-site servers, observability is manageable enough. What is OpenTelemetry?
This means you no longer have to procure new hardware, which can be a time-consuming and expensive process. No operational duties: Dynatrace operates the product for you with auto-discovery of your entire stack, end-to-end, including processes running inside containers.
One issue that often complicates this process is the "noisy neighbor" problem. To emit a run queue latency metric, we leveraged three eBPF hooks: sched_wakeup, sched_wakeup_new, and sched_switch. The sched_wakeup and sched_wakeup_new hooks are invoked when a process changes state from 'sleeping' to 'runnable.'
We often dwell on the technical aspects of database selection, focusing on performance metrics , storage capacity, and querying capabilities. The New Decision Matrix: Beyond Performance Metrics Performance metrics are pivotal, no doubt. How do these metrics translate into real-world value for your business?
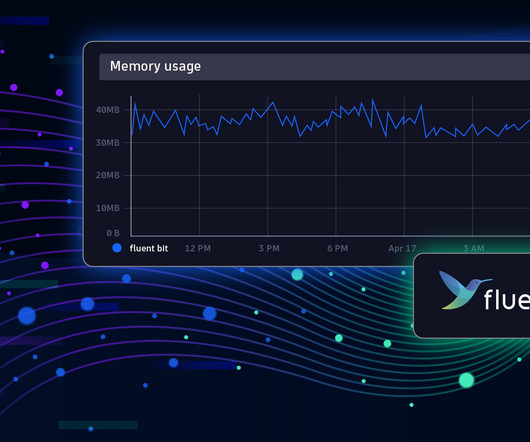
Fluent Bit is a telemetry agent designed to receive data (logs, traces, and metrics), process or modify it, and export it to a destination. Fluent Bit and Fluentd were created for the same purpose: collecting and processing logs, traces, and metrics. Observability: Elevating Logs, Metrics, and Traces!
Replay traffic testing gives us the initial foundation of validation, but as our migration process unfolds, we are met with the need for a carefully controlled migration process. A process that doesn’t just minimize risk, but also facilitates a continuous evaluation of the rollout’s impact.
Code coverage is a software quality metric commonly used during the development process that let’s you determine the degree of code that has been tested (or executed). To achieve optimal code coverage, it is essential that the test implementation (or test suites) tests a majority percent of the implemented code.
Any service provider tries to reach several metrics in their activity. One group of these metrics is service quality. Quality metrics contain: The ratio of successfully processed requests. Distribution of processing time between requests. Number of requests dependent curves.
Event Prioritization Considering the use cases were wide ranging both in terms of their sources and their importance, we built segmentation into the event processing. We thus assigned a priority to each use case and sharded event traffic by routing to priority-specific queues and the corresponding event processing clusters.
Monitoring and observability are two key concepts that facilitate this process, offering valuable visibility into the health and performance of systems. It typically involves setting up specific metrics, thresholds, and alerting mechanisms to track the performance and availability of various components.
Using OpenTelemetry, developers can collect and process telemetry data from applications, services, and systems. Observability Observability is the ability to determine a system’s health by analyzing the data it generates, such as logs, metrics, and traces. There are three main types of telemetry data: Metrics.
By implementing service-level objectives, teams can avoid collecting and checking a huge amount of metrics for each service. When organizations implement SLOs, they can improve software development processes and application performance. The performance SLO needs a custom SLI metric, which you can configure as follows.
The second phase involves migrating the traffic over to the new systems in a manner that mitigates the risk of incidents while continually monitoring and confirming that we are meeting crucial metrics tracked at multiple levels. The batch job creates a high-level summary that captures some key comparison metrics.
Any time you run a test with WebPageTest, you’ll get this table of different milestones and metrics. Higher variance means a less stable metric across pages. I can see from the screenshot above that TTFB is my most stable metrics—no one page appears to have particularly expensive database queries or API calls on the back-end.
Automating quality gates is ideal, as it minimizes manually checking and validating key metrics throughout the SDLC. By actively monitoring metrics such as error rate, success rate, and CPU load, quality gates instill confidence in teams during software releases. Several tools can be used to collect metrics in load/performance testing.
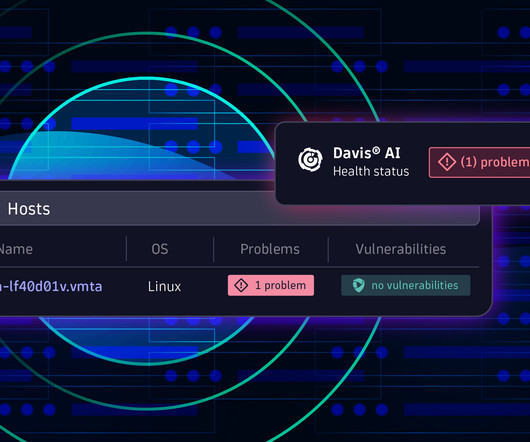
The newly introduced Network devices and Details view within Hosts provide comprehensive health status information, relevant networking signals, and machine metrics—all analyzed and provided by the industry-leading combination of Dynatrace Grail™ data lakehouse and Davis ® AI. Overview of a cloud-hosted frontend web application.
In this post, let’s explore a key performance metric studied during garbage collection analysis: "GC throughput." During that pause period, no customer transactions will be processed. We’ll understand what it means, its significance in Java applications, and how it impacts overall performance.
A $20 billion Germany-based financial services company told us they found the process of pushing Syslog messages to Dynatrace natively to be seamless. Logs are immediately available for troubleshooting, security investigations, and auditing, becoming integral to the platform alongside traces and metrics.
But existing business intelligence (BI) tools often lack the broad context, ease of data access, and real-time insights needed to understand and improve customer experience and complex business processes. However, in the real world, business-related data isn’t limited to metrics.
We’ll explore the process of defining SLOs and using the API to scale-out SLOs. The measurement equates to a metric that captures expected results. The first step to defining an SLO is to identify the success metric. Synthetic metrics (Synthetic). Log Metrics (Log). Defining SLIs. Services (Service).
Hence we built the data pipeline that can be used to extract the existing assets metadata and process it specifically to each new use case. After reading the asset ids using one of the ways, an event is created per asset id to be processed synchronously or asynchronously based on the use case.
From a cost perspective, internal customers waste valuable time sending tickets to operations teams asking for metrics, logs, and traces to be enabled. A team looking for metrics, traces, and logs no longer needs to file a ticket to get their app monitored in their own environments. This approach is costly and error prone.
Dynatrace provides server metrics monitoring in under five minutes, showing servers’ CPU, memory, and network health metrics all the way through to the process level, with no manual configuration necessary. AL2023 is supported by Dynatrace on day one and has been thoroughly tested by our installations team.
The ops team understood the concept of business metrics like NPS, conversions rates, even call center volume—but believed these KPIs were meant for other teams. Similarly, IT’s solid SLOs and Apdex scores—important metrics agreed upon by the app owner and IT—were met with a lack of enthusiasm by the business team.
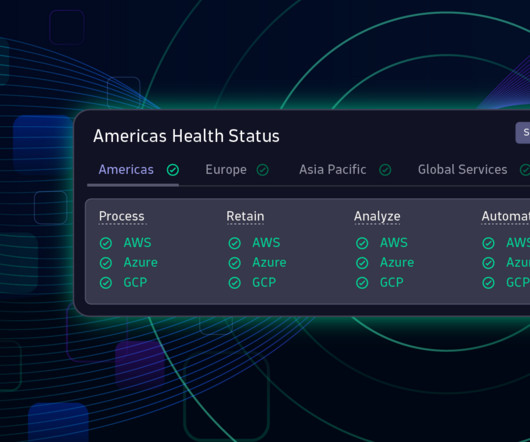
To transparently manage expectations and maintain trust with our customers, we expanded the Dynatrace SLA beyond accessing the user interface to cover the full range of relevant product categories, such as processing and retaining incoming data, accessing and working with data, and triggering automations.
These technologies are poorly suited to address the needs of modern enterprises—getting real value from data beyond isolated metrics. As a result, we created Grail with three different building blocks, each serving a special duty: Ingest and process. Ingest and process with Grail. Thus, Grail was born. Retain data.
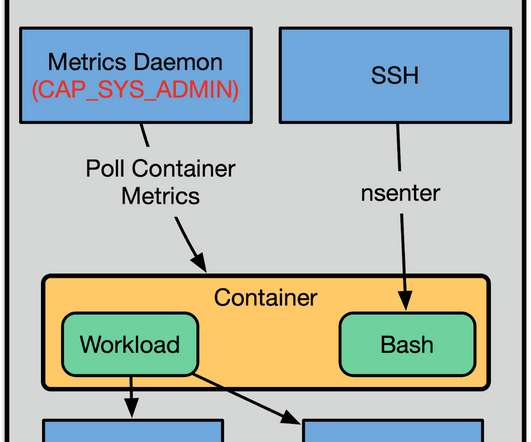
For example, the PID namespace makes it so that a process can only see PIDs in its own namespace, and therefore cannot send kill signals to random processes on the host. There are also more common capabilities that are granted to users like CAP_NET_RAW, which allows a process the ability to open raw sockets. User Namespaces.
We organize all of the trending information in your field so you don't have to. Join 5,000+ users and stay up to date on the latest articles your peers are reading.
You know about us, now we want to get to know you!
Let's personalize your content
Let's get even more personalized
We recognize your account from another site in our network, please click 'Send Email' below to continue with verifying your account and setting a password.


Let's personalize your content