This site uses cookies to improve your experience. To help us insure we adhere to various privacy regulations, please select your country/region of residence. If you do not select a country, we will assume you are from the United States. Select your Cookie Settings or view our Privacy Policy and Terms of Use.
Cookie Settings
Cookies and similar technologies are used on this website for proper function of the website, for tracking performance analytics and for marketing purposes. We and some of our third-party providers may use cookie data for various purposes. Please review the cookie settings below and choose your preference.
Used for the proper function of the website
Used for monitoring website traffic and interactions
Cookie Settings
Cookies and similar technologies are used on this website for proper function of the website, for tracking performance analytics and for marketing purposes. We and some of our third-party providers may use cookie data for various purposes. Please review the cookie settings below and choose your preference.
Strictly Necessary: Used for the proper function of the website
Performance/Analytics: Used for monitoring website traffic and interactions
Business processes support virtually all aspects of an organizations operations. Theyre often categorized by their function; core processes directly create customer value, support processes increase departmental efficiency, and management processes drive strategic goals and compliance.
In IT and cloud computing, observability is the ability to measure a system’s current state based on the data it generates, such as logs, metrics, and traces. An advanced observability solution can also be used to automate more processes, increasing efficiency and innovation among Ops and Apps teams. What is observability?
Dynatrace OpenPipeline is a new stream processing technology that ingests and contextualizes data from any source. For years, logs have been the dominant approach many observability vendors have taken to report business metrics on dashboards. Business process monitoring and optimization.
Imagine you’re using a lot of OpenTelemetry and Prometheus metrics on a crucial platform. A histogram is a specific type of metric that allows users to understand the distribution of data points over a period of time. You’re gathering a lot of data, but you can’t make sense of it. What are histograms, and why use them?
My goal was to provide IT teams with insights to optimize customer experience by collaborating with business teams, using both business KPIs and IT metrics. Consolidate real-user monitoring, synthetic monitoring, session replay, observability, and business process analytics tools into a unified platform.
You can now: Kickstart your creation journey using ready-made dashboards Accelerate your data exploration with seamless integration between apps Start from scratch with the new Explore interface Search for known metrics from anywhere Let’s look at each of these paths through an end-to-end use case focused on Kubernetes monitoring.
Ensuring smooth operations is no small feat, whether you’re in charge of application performance, IT infrastructure, or business processes. Chances are, youre a seasoned expert who visualizes meticulously identified key metrics across several sophisticated charts.
This lets you build your SLOs around the indicators that matter to you and your customers—critical metrics related to availability, failure rates, request response times, or select logs and business events. Hence, having a dedicated dashboard tile visualizing the key parameters of each SLO simplifies the process of evaluating them.
The business process observability challenge Increasingly dynamic business conditions demand business agility; reacting to a supply chain disruption and optimizing order fulfillment are simple but illustrative examples. Most business processes are not monitored. First and foremost, it’s a data problem.
I realized that our platforms unique ability to contextualize security events, metrics, logs, traces, and user behavior could revolutionize the security domain by converging observability and security. Carefully planning and integrating new processes and tools is critical to ensuring compliance without disrupting daily operations.
One of the more popular use cases is monitoring business processes, the structured steps that produce a product or service designed to fulfill organizational objectives. By treating processes as assets with measurable key performance indicators (KPIs), business process monitoring helps IT and business teams align toward shared business goals.
DataJunction: Unifying Experimentation and Analytics Yian Shang , AnhLe At Netflix, like in many organizations, creating and using metrics is often more complex than it should be. DJ acts as a central store where metric definitions can live and evolve. As an example, imagine an analyst wanting to create a Total Streaming Hours metric.
Unrealized optimization potential of business processes due to monitoring gaps Imagine a retail company facing gaps in its business process monitoring due to disparate data sources. Due to separated systems that handle different parts of the process, the view of the process is fragmented.
By integrating Dynatrace with GitHub Actions, you can proactively monitor for potential issues or slowdowns in the deployment processes. Automating GitHub runner data ingestion with Dynatrace workflows Workflows within the Dynatrace SaaS platform are a robust tool for automating complex processes.
A Data Movement and Processing Platform @ Netflix By Bo Lei , Guilherme Pires , James Shao , Kasturi Chatterjee , Sujay Jain , Vlad Sydorenko Background Realtime processing technologies (A.K.A stream processing) is one of the key factors that enable Netflix to maintain its leading position in the competition of entertaining our users.
This is achieved, in part, by establishing actionable statistical accuracy —not necessarily precise accuracy —through practical levels of metric sampling, aggregation, and extrapolation. Introducing metric extraction from business events Beginning with Dynatrace SaaS version 1.257, you can extract metrics from ingested business events.
Davis is the causational AI from Dynatrace that processes billions of events and dependencies and constantly analyzes your IT infrastructure. Dynatrace metric events offer the flexibility needed to customize your anomaly detection configuration. Firstly, an anomaly detector known as a metric key analyzes the incoming raw data ingest.
To get a more granular look into telemetry data, many analysts rely on custom metrics using Prometheus. Named after the Greek god who brought fire down from Mount Olympus, Prometheus metrics have been transforming observability since the project’s inception in 2012.
A Dynatrace API token with the following permissions: Ingest OpenTelemetry traces ( openTelemetryTrace.ingest ) Ingest metrics ( metrics.ingest ) Ingest logs ( logs.ingest ) To set up the token, see Dynatrace API – Tokens and authentication in Dynatrace documentation. If you don’t have one, you can use a trial account.
The Dynatrace platform automatically captures and maps metrics, logs, traces, events, user experience data, and security signals into a single datastore, performing contextual analytics through a “power of three AI”—combining causal, predictive, and generative AI. It’s about uncovering insights that move business forward. With over 2.5
Organizations choose data-driven approaches to maximize the value of their data, achieve better business outcomes, and realize cost savings by improving their products, services, and processes. Data is then dynamically routed into pipelines for further processing. Understanding the context.
However, due to the fact that they boil down selected indicators to single values and track error budget levels, they also offer a suitable way to monitor optimization processes while aligning on single values to meet overall goals. By recognizing the insights provided, you can optimize processes and improve overall efficiency.
Finally, it empowers automated systems to process and analyze OpenTelemetry data, without requiring adaptations for every framework. Semconv for HTTP Spans quite possibly the most important signal have been declared stable, and HTTP Metrics will hopefully soon follow.
Dynatrace Simple Workflows make this process automatic and frictionlessthere is no additional cost for workflows. Why manual alerting falls short As your product and deployments scale horizontally and vertically, the sheer volume of data makes it impossible for teams to catch every error quickly using manual processes.
The five key metrics to improve customer satisfaction To help turn this around, Dynatrace makes available its unified observability platform, which captures all CX interactions and transactions in an automated, intelligent manner – including user session replays. When combined, key metrics will generate an accurate CX index score.
Integration with existing systems and processes : Integration with existing IT infrastructure, observability solutions, and workflows often requires significant investment and customization. Actions resulting from the evaluation The certification process surfaced a few recommendations for improving the app.
Access policies for Dynatrace Grail™ data lakehouse are still available as service-related policies; they allow you to control access to the monitoring data on a per-data-source level, for example, logs and metrics. All other default policies on the service level, for example, “AutomationEngine – User” access, are now marked as Legacy.
That is, relying on metrics, logs, and traces to understand what software is doing and where it’s running into snags. In addition to tracing, observability also defines two other key concepts, metrics and logs. When software runs in a monolithic stack on on-site servers, observability is manageable enough. What is OpenTelemetry?
by Jun He , Yingyi Zhang , and Pawan Dixit Incremental processing is an approach to process new or changed data in workflows. The key advantage is that it only incrementally processes data that are newly added or updated to a dataset, instead of re-processing the complete dataset.
The Grail™ data lakehouse provides fast, auto-indexed, schema-on-read storage with massively parallel processing (MPP) to deliver immediate, contextualized answers from all data at scale. Through Azure Native Dynatrace Service, customers can seamlessly adopt these technologies to modernize and enhance their cloud operations.
The Dynatrace platform now enables comprehensive data exploration and interactive analytics across data sets (trace, logs, events, and metrics)empowering you to solve complex use cases, handle any observability scenario, and gain unprecedented visibility into your systems.
The Challenge of Title Launch Observability As engineers, were wired to track system metrics like error rates, latencies, and CPU utilizationbut what about metrics that matter to a titlessuccess? Option 1: Log Processing Log processing offers a straightforward solution for monitoring and analyzing title launches.
It requires a state-of-the-art system that can track and process these impressions while maintaining a detailed history of each profiles exposure. In this multi-part blog series, we take you behind the scenes of our system that processes billions of impressions daily.
Proper setup involves creating a configuration process that accounts for hostname changes, which could prevent nodes from rejoining the cluster. Message load balancing guarantees that messages are processed evenly across different queues and nodes within the RabbitMQ system. Erlang is the backbone of RabbitMQ clustering.
The configuration also includes an optional span metrics connector, which generates Request, Error, and Duration (R.E.D.) metrics from span data. The configuration also includes an optional span metrics connector, which generates Request, Error, and Duration (R.E.D.) metrics from span data.
Break data silos and add context for faster, more strategic decisions : Unifying metrics, logs, traces, and user behavior within a single platform enables real-time decisions rooted in full context, not guesswork. IT teams must now ingest petabytes of data and then store, process, and query it cost-effectively and securely.
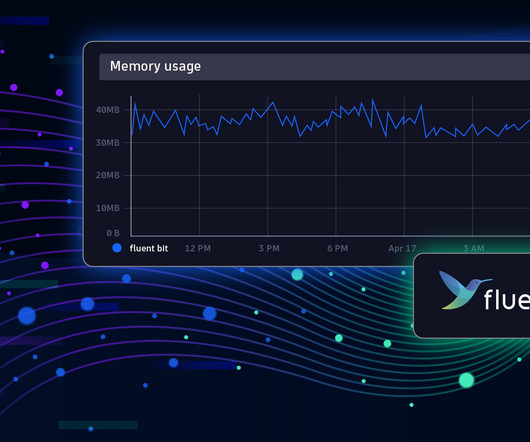
Fluent Bit is a telemetry agent designed to receive data (logs, traces, and metrics), process or modify it, and export it to a destination. Fluent Bit and Fluentd were created for the same purpose: collecting and processing logs, traces, and metrics. Observability: Elevating Logs, Metrics, and Traces!
One issue that often complicates this process is the "noisy neighbor" problem. To emit a run queue latency metric, we leveraged three eBPF hooks: sched_wakeup, sched_wakeup_new, and sched_switch. The sched_wakeup and sched_wakeup_new hooks are invoked when a process changes state from 'sleeping' to 'runnable.'
This means you no longer have to procure new hardware, which can be a time-consuming and expensive process. No operational duties: Dynatrace operates the product for you with auto-discovery of your entire stack, end-to-end, including processes running inside containers.
The primary goals of these campaigns are to encourage more people to install and play the games, making incremental installs and engagement crucial metrics for evaluating their effectiveness. Each format has a different production process and different patterns of cash spend, called our Content Forecast.
By implementing service-level objectives, teams can avoid collecting and checking a huge amount of metrics for each service. When organizations implement SLOs, they can improve software development processes and application performance. The performance SLO needs a custom SLI metric, which you can configure as follows.
Imagine a ML practitioner on the Netflix Content ML team, sourcing features from hundreds of columns in our data warehouse, and creating a multitude of models against a growing suite of metrics. You can see the actual command and args that were sub-processed in the Metaboost Execution section below.
We often dwell on the technical aspects of database selection, focusing on performance metrics , storage capacity, and querying capabilities. The New Decision Matrix: Beyond Performance Metrics Performance metrics are pivotal, no doubt. How do these metrics translate into real-world value for your business?
We organize all of the trending information in your field so you don't have to. Join 5,000+ users and stay up to date on the latest articles your peers are reading.
You know about us, now we want to get to know you!
Let's personalize your content
Let's get even more personalized
We recognize your account from another site in our network, please click 'Send Email' below to continue with verifying your account and setting a password.


Let's personalize your content