This site uses cookies to improve your experience. To help us insure we adhere to various privacy regulations, please select your country/region of residence. If you do not select a country, we will assume you are from the United States. Select your Cookie Settings or view our Privacy Policy and Terms of Use.
Cookie Settings
Cookies and similar technologies are used on this website for proper function of the website, for tracking performance analytics and for marketing purposes. We and some of our third-party providers may use cookie data for various purposes. Please review the cookie settings below and choose your preference.
Used for the proper function of the website
Used for monitoring website traffic and interactions
Cookie Settings
Cookies and similar technologies are used on this website for proper function of the website, for tracking performance analytics and for marketing purposes. We and some of our third-party providers may use cookie data for various purposes. Please review the cookie settings below and choose your preference.
Strictly Necessary: Used for the proper function of the website
Performance/Analytics: Used for monitoring website traffic and interactions
Break data silos and add context for faster, more strategic decisions : Unifying metrics, logs, traces, and user behavior within a single platform enables real-time decisions rooted in full context, not guesswork. Generative AI enhances response speed and clarity, accelerating incident resolution and boosting team productivity.
Our latest enhancements to the Dynatrace Dashboards and Notebooks apps make learning DQL optional in your day-to-day work, speeding up your troubleshooting and optimization tasks. Next, let’s use the Kubernetes app to investigate more metrics.
Mobile applications (apps) are an increasingly important channel for reaching customers, but the distributed nature of mobile app platforms and delivery networks can cause performance problems that leave users frustrated, or worse, turning to competitors. What is mobile app performance? Some of the most important KPIs are listed below.
With Dynatrace, customers can utilize the full set of Azure capabilities, including metrics and data from the Azure platform, and automatically identify workflow optimization opportunities. By prioritizing observability, organizations can ensure the availability, performance, and security of business-critical applications.
Synthetic monitors are also the perfect tool to monitor performance baselines. This clean-room, lab-like environment allows you to react to slight changes in performance. It also gives you the first indication of whether a new deployment of your application or API leads to a performance improvement or, perhaps, a regression.
Whether you’re a seasoned IT expert or a marketing professional looking to improve business performance, understanding the data available to you is essential. With Dashboards , you can monitor business performance, user interactions, security vulnerabilities, IT infrastructure health, and so much more, all in real time.
Speed, UX, availability, and frequency of updates are increasingly important with mobile apps. The responsibility of developers keeps growing, and as mobile apps get more complex, new tools for mobile performance monitoring and testing are being born. Consumers and enterprises alike expect more from software.
The Dynatrace platform automatically captures and maps metrics, logs, traces, events, user experience data, and security signals into a single datastore, performing contextual analytics through a “power of three AI”—combining causal, predictive, and generative AI. What’s behind it all? The result?
Let's kick off the new year by celebrating someone who has not just had a huge impact on web performance over the past few years, but who has even more exciting stuff in the works for the future: Annie Sullivan! Annie and her team navigate this arduous task with true passion for web performance and for improving the user experience.
Automating quality gates is ideal, as it minimizes manually checking and validating key metrics throughout the SDLC. By actively monitoring metrics such as error rate, success rate, and CPU load, quality gates instill confidence in teams during software releases. Several tools can be used to collect metrics in load/performance testing.
Echoing John Van Siclen’s sentiments from his Perform 2020 keynote, Steve cited Dynatrace customers as the inspiration and driving force for these innovations. “A Highlighting the company’s announcements from Perform 2020, Steve and a team of other Dynatrace product leaders introduced the audience to several of our latest innovations.
I realized that our platforms unique ability to contextualize security events, metrics, logs, traces, and user behavior could revolutionize the security domain by converging observability and security. Collect observability and security data user behavior, metrics, events, logs, traces (UMELT) once, store it together and analyze in context.
Speed and scalability are significant issues today, at least in the application landscape. Among the critical enablers for fast data access implementation within in-memory data stores are the game changers in recent times, which are technologies like Redis and Memcached. However, the question arises of choosing the best one.
Dynatrace has recently enhanced its Metrics APIs, allowing everyone to send any type of metric with any set of data dimension to Davis, Dynatrace’s AI engine. All your JMeter results in Dynatrace for better performance engineering. In our conversation, I mentioned the new Dynatrace Metrics ingestion and off we went. ??
Dynatrace Visually complete is a point-in-time web performancemetric that measures when the visual area of a page has finished loading. Dynatrace is the only solution that provides these user experience metrics consistently for real user monitoring as well as for synthetic monitors. More precisely, you can now: .
These are just some of the topics being showcased at Perform 2023 in Las Vegas. Perform 2023 news At Perform 2023 in Las Vegas, the headliner theme is IT automation. IT pros need a data and analytics platform that doesn’t require sacrifices among speed, scale, and cost. We’ll post news here as it happens!
Metrics matter. But without complex analytics to make sense of them in context, metrics are often too raw to be useful on their own. To achieve relevant insights, raw metrics typically need to be processed through filtering, aggregation, or arithmetic operations. Examples of metric calculations. Dynatrace news.
Similar to the observability desired for a request being processed by your digital services, it’s necessary to comprehend the metrics, traces, logs, and events associated with a code change from development through to production. BlackDuck performs a security and vulnerability check, returning a scan result.
Managing cloud performance is increasingly challenging for organizations that spread workloads across a greater variety of platforms. Moreover, organizations have to balance maintaining security, retaining cloud management expertise, and managing infrastructure performance. Rural lifestyle retail giant Tractor Supply Co.
In this blog, I will be going through a step-by-step guide on how to automate SRE-driven performance engineering. Step-by-step guide: SRE-driven performance analysis with Dynatrace. Dynatrace news. Keptn uses SLO definitions to automatically configure Dynatrace or Prometheus alerting rules. This is what this blog is all about.
Ben Rushlo, Dynatrace Vice President of DEM Services, puts it this way: “As performance degrades, user experience degrades, engagement degrades, and business outcomes degrade.” Metrics that offer measurable, repeatable insight into the user experience from the moment they arrive on a website from a mobile or desktop device.
As organizations develop more applications and microservices, they are discovering they also need to run more performance tests in the same amount of time or less to meet service-level objectives (SLOs) that fulfill service-level agreements (SLAs). Current challenges with performance testing.
Here are some common questions I’m asked when I talk with people about performance: Which metrics should I care about? Page Speed Benchmarks is an interactive dashboard that lets you explore and compare web performance data for leading websites across several industries – from retail to media.
Web Performance is important for user experience and business metrics. This post explains several ways of assessing the potential performance gains with little effort and, more importantly, without actually implementing fixes. What is the business opportunity for web performance improvements? I would repeat over and over.
Dynatrace CEO Rick McConnell at Perform 2022 in Las Vegas. Organizations are accelerating movement to the cloud, resulting in complex combinations of hybrid, multicloud [architecture],” said Rick McConnell, Dynatrace chief executive officer at the annual Perform conference in Las Vegas this week. We gather logs, metrics and traces.
We often dwell on the technical aspects of database selection, focusing on performancemetrics , storage capacity, and querying capabilities. The New Decision Matrix: Beyond PerformanceMetricsPerformancemetrics are pivotal, no doubt. How do these metrics translate into real-world value for your business?
Performance and error optimization is complicated, and the approach to driving improvement has long relied on static recommendations disconnected from a site’s end users and their experiences. Sometimes, these recommendations are so far from current performance or cost so much to implement that they seem irrelevant or unattainable.
Dynatrace container monitoring supports customers as they collect metrics, traces, logs, and other observability-enabled data to improve the health and performance of containerized applications. The post Container monitoring for VA Platform One helps VA achieve workload performance appeared first on Dynatrace news.
You’re optimizing the performance of some website, scrutinizing every millisecond it takes for the current page to load. You’ve fired up Google Lighthouse from Chrome’s DevTools because everyone and their uncle uses it to evaluate performance. Google Lighthouse is merely one tool in a complete performance toolkit.
Poor user experience or application performance negates any advantages you achieve in delivery speed or production cost. Understanding software quality metrics, especially in automated testing, helps us identify what is working well and what needs improvement. Learn more about manual and automated testing!
If you could measure the impact of site speed on your business, how valuable would that be for you? Here's the truth: The business folks in your organization probably don't care about page speedmetrics. But that doesn't mean they don't care about page speed. Say hello to correlation charts – your new best friend.
We accomplish this by gathering detailed column-level metrics that offer insights into the state and quality of each impression. These metrics include everything from validating identifiers to checking that essential columns are properly filled.
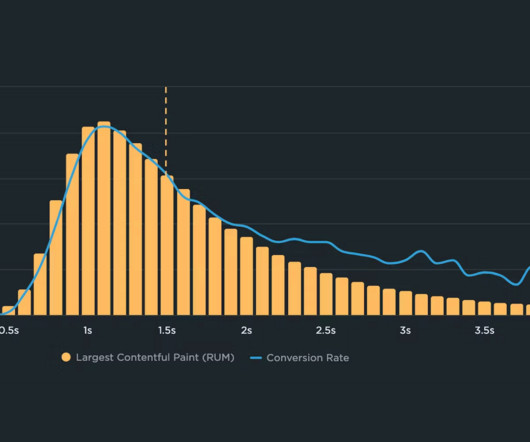
I never thought I’d write an article in defence of DOMContentLoaded , but here it is… For many, many years now, performance engineers have been making a concerted effort to move away from technical metrics such as Load , and toward more user-facing, UX metrics such as Speed Index or Largest Contentful Paint. Or are they…?
VMAF is a video quality metric that Netflix jointly developed with a number of university collaborators and open-sourced on Github. VMAF has become a de facto standard for evaluating the performance of encoding systems and driving encoding optimizations. This tech blog highlights our recent progress toward this goal.
They collect data from multiple sources through real user monitoring , synthetic monitoring, network monitoring, and application performance monitoring systems. It also enables ITOps to identify performance issues in real time for fast mean time to detect/repair and to continuously optimize performance to improve the overall user experience.
This article outlines the key differences in architecture, performance, and use cases to help determine the best fit for your workload. Architecture Comparison RabbitMQ and Kafka have distinct architectural designs that influence their performance and suitability for different use cases.
Google do strongly encourage you to focus on site speed for better performance in Search, but, if you don’t pass all relevant Core Web Vitals (and the applicable factors from the Page Experience report) they will not push you down the rankings. While Core Web Vitals can help with SEO, there’s so much more to site-speed than that.
The short answer: The three pillars of observability—logs, metrics, and traces—converging on a data lakehouse. As teams try to gain insight into this data deluge, they have to balance the need for speed, data fidelity, and scale with capacity constraints and cost. Logs on Grail Log data is foundational for any IT analytics.
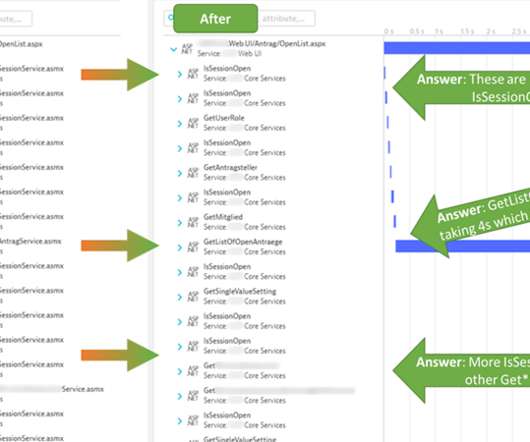
The challenge with ASP.NET Web Service Observability, Diagnostics and Performance Optimization is that most monitoring & diagnostic tools only provide global Service Level Indicators metrics (SLIs) such as response time, failure rate, and throughput, but not metrics for each individual service endpoint. Dynatrace news.
A thing I see developers do time and time again is make performance-facing changes to their sites and apps, but mistakes in how they measure them often lead to incorrect conclusions about the effectiveness of that work. Problems When Measuring Performance. This can go either way: under- or overestimating the efficacy of those changes.
These technologies are poorly suited to address the needs of modern enterprises—getting real value from data beyond isolated metrics. Further, it builds a rich analytics layer powered by Dynatrace causational artificial intelligence, Davis® AI, and creates a query engine that offers insights at unmatched speed. Thus, Grail was born.
We love writing articles and blog posts that help folks solve real web performance and UX problems. Some of these articles come from our recently published Web Performance Guide – a collection of evergreen how-to resources (written by actual humans!) Here are the ones you loved most in 2024. The number one item may surprise you!)
Mining and public transportation organizations commonly rely on IoT to monitor vehicle status and performance and ensure fuel efficiency and operational safety. Both methods allow you to ingest and process raw data and metrics. This information is essential for later advanced analytics and aircraft tracking.
Logs assist operations, security, and development teams in ensuring the reliability and performance of application environments. These traditional approaches to log monitoring and log analytics thwart IT teams’ goal to address infrastructure performance problems, security threats, and user experience issues.
We organize all of the trending information in your field so you don't have to. Join 5,000+ users and stay up to date on the latest articles your peers are reading.
You know about us, now we want to get to know you!
Let's personalize your content
Let's get even more personalized
We recognize your account from another site in our network, please click 'Send Email' below to continue with verifying your account and setting a password.


Let's personalize your content