This site uses cookies to improve your experience. To help us insure we adhere to various privacy regulations, please select your country/region of residence. If you do not select a country, we will assume you are from the United States. Select your Cookie Settings or view our Privacy Policy and Terms of Use.
Cookie Settings
Cookies and similar technologies are used on this website for proper function of the website, for tracking performance analytics and for marketing purposes. We and some of our third-party providers may use cookie data for various purposes. Please review the cookie settings below and choose your preference.
Used for the proper function of the website
Used for monitoring website traffic and interactions
Cookie Settings
Cookies and similar technologies are used on this website for proper function of the website, for tracking performance analytics and for marketing purposes. We and some of our third-party providers may use cookie data for various purposes. Please review the cookie settings below and choose your preference.
Strictly Necessary: Used for the proper function of the website
Performance/Analytics: Used for monitoring website traffic and interactions
For most who work in the retail sector, the pandemic has been an unwelcome test of our ability to cope with disruption. In eight months, retailers offering curbside pickup increased from 7% to 44%, reflecting rapidly changing consumer preferences. Let’s illustrate a simple use case for a retail outlet. Dynatrace news.
Retail is one of the most important business domains for data science and data mining applications because of its prolific data and numerous optimization problems such as optimal prices, discounts, recommendations, and stock levels that can be solved using data analysis methods. However, many of these models are highly parametric (i.e.
Managing cloud performance is increasingly challenging for organizations that spread workloads across a greater variety of platforms. Moreover, organizations have to balance maintaining security, retaining cloud management expertise, and managing infrastructure performance. Rural lifestyle retail giant Tractor Supply Co.
Dynatrace recently opened up the enterprise-grade functionalities of Dynatrace OneAgent to all the data needed for observability, including metrics, events, logs, traces, and topology data. Davis topology-aware anomaly detection and alerting for your custom metrics. Seamlessly report and be alerted on topology-related custom metrics.
Recently, we simplified StatsD, Telegraf, and Prometheus observability by allowing you to capture and analyze all your custom metrics. Gain fine-grained access control for Prometheus, StatsD, and Telegraf metrics. To achieve this, you can now grant access to any single metric within a Dynatrace management zone.
Unrealized optimization potential of business processes due to monitoring gaps Imagine a retail company facing gaps in its business process monitoring due to disparate data sources. In our retail company example, older systems are involved in shipping the order. On top of that, the data sources are inconsistent.
Over the last two month s, w e’ve monito red key sites and applications across industries that have been receiving surges in traffic , including government, health insurance, retail, banking, and media. Breaking d own performance across U.S. experienced significant performance degradations. Retailperformance .
Successful deployments of cloud-native workloads at the edge help to reduce costs, boost performance, and improve customer experience. By drilling down further on the workload level, you can gain valuable insights into the performance and potential problems of any containerized workload.
These environments are marked by continuous delivery of microservice updates into production, the abstractions inherent in Kubernetes environments, and challenges associated with applications distributed across multicloud environments—often with performance and security risks. Dynatrace was recognized as Compuware from 2010-2014.
Today, IT services have a direct impact on almost every key business performance indicator, from revenue and conversions to customer satisfaction and operational efficiency. Often, these metrics are unable to even identify trends from past to present, never mind helping teams to predict future trends. Operational optimization.
Traditionally, it’s critical for Dev and Ops teams to be able to quickly discover and remediate application performance and customer-facing issues. But never have these two siloed teams been able to tie together their application performance and user experience to business metrics such as revenue, conversion rates, and customer segmentation.
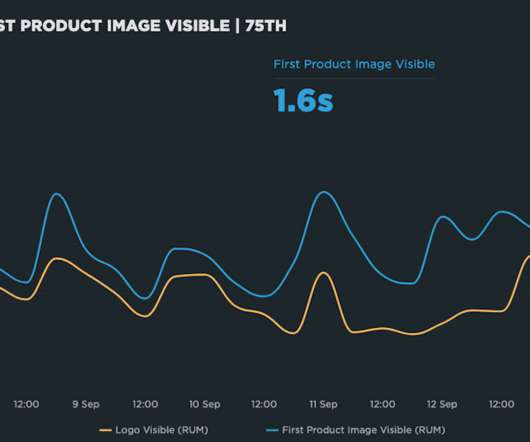
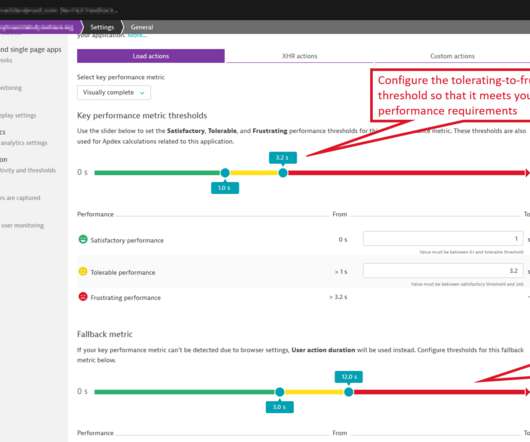
From their favorite retailer to their favorite restaurant, today’s customers place great value on every interaction they have with a brand. From that point on, Dynatrace starts writing timeseries metrics that can be used for custom charting. Different user actions also have different performance requirements.
Dynatrace business events provide precise, real-time business metrics that support fine-grained business decisions and auditable business reporting. Business data is more than metrics Dynatrace ActiveGate extensions allow you to extend Dynatrace monitoring to any remote technology that exposes an interface.
Some of these patterns can be planned for , such as peak seasons for travel and retail industries, while others are entirely spontaneous to the business. PerformanceMetrics. Bringing together dependency data and performancemetrics provides accurate breakpoint and bottleneck information in real-time.
Software developers can use causal analysis to identify the root causes of bugs or application performance issues and to predict potential system failures or performance degradations. Retailers can analyze how factors such as demand, competition, and market trends affect pricing. Software development.
retail giant, initially tied to an ingest-centric pricing vendor, found itself manually curbing costs by limiting daily log ingestion to 3 TB and reducing retention periods. Consequently, the company’s mean time to identify (MTTI) and mean time to resolve (MTTR) during peak retail seasons was too slow. A prominent U.S. Transparency.
Fast, consistent application delivery creates a positive user experience that can ultimately drive customer loyalty and improve business metrics like conversion rate and user retention. DEM can give organizations business observability—insight into the effects of user experience on the bottom line.
As a result, site reliability has emerged as a critical success metric for many organizations. Mobile retail e-commerce spending in the U. With so many of their transactions occurring online, customers are becoming more demanding, expecting websites and applications to always perform perfectly. Service-level objectives (SLOs).
Timing entries can be retrieved using a Performance Observer, and the data can be forwarded to a RUM or analytics product: const observer = new PerformanceObserver((list) => { let entries = list.getEntries().forEach((entry) You can also create performance budgets and get alerts when they exceed their thresholds.
Davis AI contextually aligns all relevant data points—such as logs, traces, and metrics—enabling teams to act quickly and accurately while still providing power users with the flexibility and depth they desire and need. The Clouds app provides a view of all available cloud-native services. Figure 11.
Real user monitoring (RUM) is a performance monitoring process that collects detailed data about a user’s interaction with an application. Real user monitoring collects data on a variety of metrics. For example, data collected on load actions can include navigation start, request start, and speed index metrics.
For retail organizations, peak traffic can be a mixed blessing. In its pursuit, IT teams hover over system performance dashboards hoping their preparations will deliver five nines—or even four nines—availability. The nightmare scenario for online retailers during peak periods, such as Black Friday and Cyber Monday, is a system crash.
Log analytics is useful for application performance monitoring in cloud, virtualized, and physical environments, including Kubernetes workloads, application security, and business analytics. Peak performance analysis. This is also known as root-cause analysis. Fault isolation. Indexing overhead. Poor root-cause analysis.
Log analytics is useful for application performance monitoring in cloud, virtualized, and physical environments, including Kubernetes workloads, application security, and business analytics. Peak performance analysis. This is also known as root-cause analysis. Fault isolation. Indexing overhead. Poor root-cause analysis.
At Dynatrace Perform 2023 , Maciej Pawlowski, senior director of product management for infrastructure monitoring at Dynatrace, and a senior software engineer at a U.K.-based Metrics and traces give context to a user’s objectives, such as checking a bank balance, making a payment, or applying for a mortgage. Seamless integration.
One recent public example is Zalando, a German retailer. For years, Dynatrace has helped companies across the world with our Real User Monitoring and Synthetic Monitoring solutions for managing application performance. Apdex is an industry standard that has existed since the early days of Web Performance Optimization (WPO).
The study analyzes factual Kubernetes production data from thousands of organizations worldwide that are using the Dynatrace Software Intelligence Platform to keep their Kubernetes clusters secure, healthy, and high performing. In general, metrics collectors and providers are most common, followed by log and tracing projects.
Here are some common questions I’m asked when I talk with people about performance: Which metrics should I care about? Page Speed Benchmarks is an interactive dashboard that lets you explore and compare web performance data for leading websites across several industries – from retail to media.
Some of you may remember the Amazon outage of 2013, when the retail behemoth went down for 40 minutes. There are three metrics that are hit hard by slow page load times: Abandonment rate Revenue Brand health Let’s take a deeper dive into the data behind each of these metrics. seconds) was much less – just $4,100.
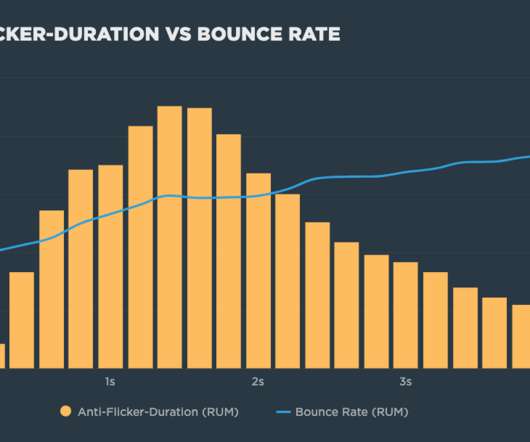
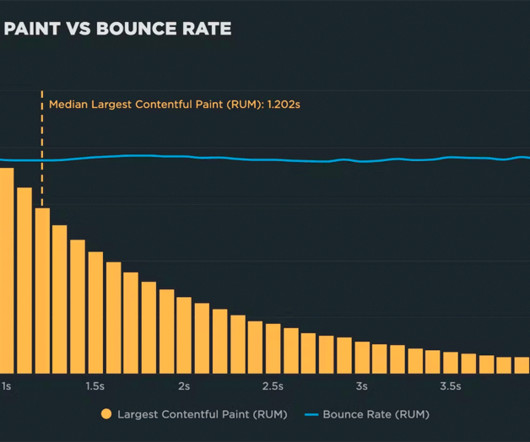
But this practice comes with some performance measurement pitfalls: Hiding the contents of the page can have a dramatic effect on the Web Vitals that measure visual experience, such as First Contentful Paint (FCP) and Largest Contentful Paint (LCP). Update the Optimize anti-flicker snippet to include performance marks and measures.
Today’s organizations face increasing pressure to keep their cloud-based applications performing and secure. As data from different corners of the enterprise proliferates, teams need a better way to bring data together to identify performance and security issues, minimize security risk, and drive greater business value.
"I made my pages faster, but my business and user engagement metrics didn't change. How can I demonstrate the business value of performance to people in my organization?" If you've ever asked yourself any of these questions, then you could find the answers in identifying and understanding the performance poverty line for your site.
FinOps helps engineering, development, finance, and business teams meet critical key performance indicators (KPIs) and fulfill service-level agreements. Today, many global industries implement FinOps, including telecommunications, retail, manufacturing, and energy conservation, as well as most Fortune 50 companies.
Here's the truth: The business folks in your organization probably don't care about page speed metrics. It just means you need to talk with them using metrics they already care about – such as conversion rate, revenue, and bounce rate. Each cohort shows you the median time for whatever metric you're tracking for the session.
Many organizations — particularly those in the securities and investment services, banking, and retail sectors — have also targeted customer experience enhancements. It should create a vision for how to evolve in the future and a digital transformation roadmap that outlines how to get there.
Business events are prioritized over metric events and observability data to deliver lossless precision. Consider the following business revenue use case: A retail chain wants to boost the average checkout transaction value by encouraging customers to add additional items to their purchase. What are business events? Average sale value.
If you've invested countless hours in speeding up your pages, but you're not using performance budgets to prevent regressions, you could be at risk of wasting all your efforts. Background: How performance budgets work 1. What is a performance budget? What should a performance budget look like? Let's get started!
I’m at Shop.org this week, having really interesting conversations with online retailers. What I love about talking with this crowd is that – like me – they're super focused on user-perceived performance. Making customers happy is the not-so-secret secret to retail success. What's making my pages seem slower?
Dynatrace business events provide precise, real-time business metrics that support fine-grained business decisions and auditable business reporting. Business data is more than metrics Dynatrace Extensions enable the expansion of Dynatrace monitoring to encompass any technology that provides an interface.
Today, we added two important choices for customers running high performance apps in the cloud: support for Redis in Amazon ElastiCache and a new high memory database instance (db.cr1.8xlarge) for Amazon RDS. AWS offers its customers a choice of different database services, each optimized for different workloads.
As web perfectionists, we have heard every excuse in the book for why teams cannot make web performance a priority. Whether it be time, money, or technical know how, every day we talk to eCommerce and Retail teams who explain why they aren’t monitoring their site’s performance. Sure, that can be the case.
So I thought it would be fun to spend some time poking around behind the scenes and give the site a holiday performance audit. Background For this performance audit, I looked at this synthetic test for the LEGO.com home page. (We The performance team is clearly doing a good job of fighting page bloat. Are images optimized?
Nines are not enough: meaningful metrics for clouds Mogul & Wilkes, HotOS’19. Is a performance brownout an outage? It also treats all outages as equal, whereas an outage on Black Friday for a retailer is much worse than an outage on a quiet day of the year. What is ‘up’? The VM is provisioned? The VM is running an OS?
If you've been working in the performance space for a while and you hear me start to talk about page growth, I'd forgive you if you started running away. ;). How does page bloat affect other metrics, such as Google's Core Web Vitals? I've been writing about page size and complexity for years. How does page bloat hurt your business?
We organize all of the trending information in your field so you don't have to. Join 5,000+ users and stay up to date on the latest articles your peers are reading.
You know about us, now we want to get to know you!
Let's personalize your content
Let's get even more personalized
We recognize your account from another site in our network, please click 'Send Email' below to continue with verifying your account and setting a password.


Let's personalize your content