This site uses cookies to improve your experience. To help us insure we adhere to various privacy regulations, please select your country/region of residence. If you do not select a country, we will assume you are from the United States. Select your Cookie Settings or view our Privacy Policy and Terms of Use.
Cookie Settings
Cookies and similar technologies are used on this website for proper function of the website, for tracking performance analytics and for marketing purposes. We and some of our third-party providers may use cookie data for various purposes. Please review the cookie settings below and choose your preference.
Used for the proper function of the website
Used for monitoring website traffic and interactions
Cookie Settings
Cookies and similar technologies are used on this website for proper function of the website, for tracking performance analytics and for marketing purposes. We and some of our third-party providers may use cookie data for various purposes. Please review the cookie settings below and choose your preference.
Strictly Necessary: Used for the proper function of the website
Performance/Analytics: Used for monitoring website traffic and interactions
Making sense of the average, standard deviation and percentiles in performancetesting reports. There are certain performancetestingmetrics that are essential to understand properly in order to draw the right conclusions from your tests.
A website needs to be constantly tested and optimized to be in line with Google's web and SEO guidelines. However, to tactically assess the website's performance , it needs to be measured in a well-thought-out manner. This article will learn about web performancetesting and how Core Web Vitals plays a crucial and strategic part in it.
Whenever we need to do performancetesting, mostly it is the APIs that come to mind. Testing the performance of an application by putting load on APIs or on servers and checking out various metrics or parameters falls under server-side performancetesting.
A lot of companies—even if they are aware that performance is key to their business—are often unsure of how, when, or where performancetesting sits within their development lifecycle. To make things worse, they’re also usually unsure whose responsibility performance measuring and monitoring is.
In this blog post, we’ll examine one such case where we use the Sentry JavaScript SDK to instrument Jest (which runs our frontend test suite) and how we addressed the issues that we found. We have high-level metrics for how well (or not) our CI is performing.
Some time ago Federico Toledo published PerformanceTesting with Open Source Tools- Busting The Myths. How did you get into performance engineering? I remember really liking the technical side of these tests. What load testing tools did you use? As most things in life, by chance. What is your business model?
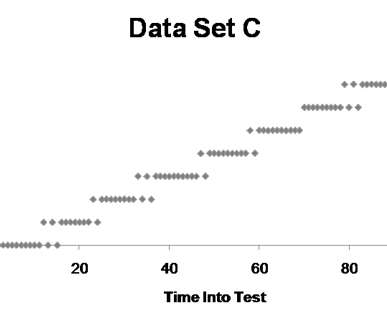
When reporting summary statistics for performancetest results, there's a common assumption that the data follows a central tendency. In such cases, the traditional metrics like averages might be misleading. But is this always true? What if the data does not exhibit a single central tendency?
As organizations develop more applications and microservices, they are discovering they also need to run more performancetests in the same amount of time or less to meet service-level objectives (SLOs) that fulfill service-level agreements (SLAs). How can organizations address this process bottleneck and run more tests in less time?
Dynatrace has recently enhanced its Metrics APIs, allowing everyone to send any type of metric with any set of data dimension to Davis, Dynatrace’s AI engine. All your JMeter results in Dynatrace for better performance engineering. For some of these tests, he’s using the open source tool Apache JMeter.
Not another figure to look at when analyzing performancetest results! Most performance tools already report a bunch of them (e.g., which we have to review for our report; why add a new metric to the list? average, min, max, percentiles.),
Development of any software is a tedious and long process, and it undergoes a series of quality and performancetests before its release and use. As the technological world evolves, so do user expectations for handling applications; it is essential to test the performance of the applications before deploying them on a large scale.
Synthetic testing simulates real-user behaviors within an application or service to pinpoint potential problems. Here’s a look at why this testing matters, how it works, and what companies need to get the most from this approach. What is synthetic testing? RUM, meanwhile, requires actual users.
Credits on content go to him and the work he has been doing around performance & resiliency testing automation. Our Application Performance Management (APM) and load test team at T-Systems MMS helps our customers reduce the risk of failed releases. Automation : Single load test executions can be repeated and tracked.
While an SLI is just a metric, an SLO just a threshold you expect your SLI to be in and SLA is just the business contract on top of an SLO. Thanks to its event-driven architecture, Keptn can pull SLIs (=metrics) from different data sources and validate them against the SLOs. class SRE implements DevOps) !
Making sense of the average, standard deviation and percentiles in performancetesting reports There are certain performancetestingmetrics that are essential to understand properly in order to.
To ensure that users get high-performing software that works seamlessly under all load conditions, performancetesting is necessary. This test helps to measure the speed, scalability, reliability, and stability of software under varying loads, thus it ensures stable performance. What Is PerformanceTesting?
Automating quality gates is ideal, as it minimizes manually checking and validating key metrics throughout the SDLC. By actively monitoring metrics such as error rate, success rate, and CPU load, quality gates instill confidence in teams during software releases. Several tools can be used to collect metrics in load/performancetesting.
For software engineering teams, this demand means not only delivering new features faster but ensuring quality, performance, and scalability too. One way to apply improvements is transforming the way application performance engineering and testing is done. Performance-as-a-self-service . Get started today! .
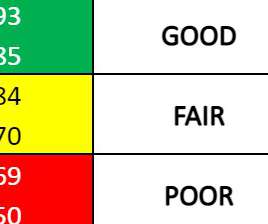
Application Performance Index. If, like me, you have some difficulties in making a Pass/Fail call for your performancetests when given the Summary Statistics of the performancetest results, then the Apdex metric may come in handy.
This post describes how the Netflix TVUI team implemented a robust strategy to quickly and easily detect performance anomalies before they are released?—?and What do we mean by Performance? Technically, “performance” metrics are those relating to the responsiveness or latency of the app, including start up time.
Define monitoring goals and user experience metrics Next, define what aspects of a digital experience you want to monitor and improve — such as website performance, application responsiveness, or user engagement — and prioritize what to measure for each application. The time it takes to begin the page’s load event.
After a new build gets deployed and automated tests executed, SLIs are evaluated against their SLOs and, depending on that result, a build is considered good (promoted) or bad (rolled back). “ Step-by-step guide: SRE-driven performance analysis with Dynatrace. This is what this blog is all about.
These development and testing practices ensure the performance of critical applications and resources to deliver loyalty-building user experiences. Real user monitoring (RUM) is a performance monitoring process that collects detailed data about users’ interactions with an application. What is synthetic monitoring?
I recently joined two industry veterans and Dynatrace partners, Syed Husain of Orasi and Paul Bruce of Neotys as panelists to discuss how performance engineering and test strategies have evolved as it pertains to customer experience. Dynatrace news. This blog summarizes our great conversation for the posed questions.
Dive into the core of performancetestingmetrics and discover the importance of accurate analysis in ensuring optimal system performance. Through simple explanations, we will guide you toward making informed decisions in your testing endeavors and identifying performance bottlenecks.
Validation tasks are then extended left to cover performancetesting and release validation in a pre-production environment. Resilient applications with chaos testing in pre-production Another Dynatrace team uses a guardian as a safeguard during chaos testing.
Environment interfaces include queries for topology, metrics, problems, and user sessions to name a few. These interfaces also allow toolchains to push problem comments, events, and metrics into Dynatrace for monitored entities. Performancetest is run. The Dynatrace event API call is a single web request. Jenkins setup.
To prove this novel approach works have a look at some of the optimization results Akamas has achieved already: The automated performance optimization has resulted in great cost savings and performance improvements. Akamas also enables you to automate the analysis of the experiment metrics in powerful ways.
But, manual steps — such as reviewing test results and addressing production issues resulting from performance, resiliency, security, or functional issues — often hinder these efforts. Observability is the ability to measure a system’s current state based on the data it generates, such as logs, metrics, and traces.
Many of our users are performance engineers using Cloud Automation Quality Gates to automate the analysis of their performance and load tests – saving hours of analysis time for each test they run. You run load tests monitored with Dynatrace and you want to automatically validate to eliminate the manual analysis effort.
Gone are the days for Christian manually looking at dashboards and metrics after a new build got deployed into a testing or acceptance environment: Integrating Keptn into your existing DevOps tools such as GitLab is just a matter of an API call. A popular use case of Keptn is the SLI/SLO-based Quality Gate capability.
Let’s take a look at two key indicators from our 2018 Dynatrace ACM Survey: MTTI (Mean Time to Innovate): How long does it take to push a new feature that is fully tested, ready to go to production, until end-users receive it? We’ll go over how to integrate Dynatrace with your load & performancetesting tools (e.g.
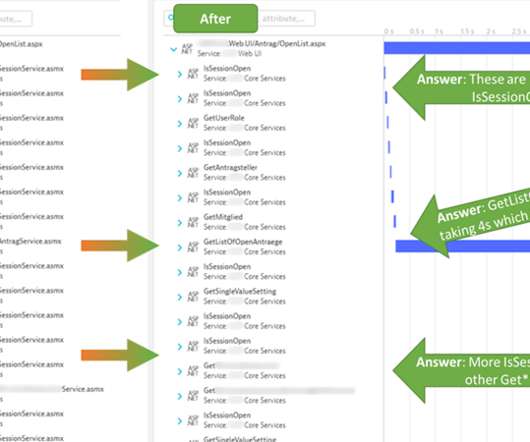
The challenge with ASP.NET Web Service Observability, Diagnostics and Performance Optimization is that most monitoring & diagnostic tools only provide global Service Level Indicators metrics (SLIs) such as response time, failure rate, and throughput, but not metrics for each individual service endpoint.
Performancetesting aims to enhance software application’s effectiveness and readiness. At the heart of this process is a metric called ‘throughput’ Let’s delve deeper into the nuances of throughput and its undeniable importance. In the vast realm of performancetesting, if there’s one metric that.
Below are some of the key metrics that need to be monitored during performancetesting: CPU utilization. Let's take a look at some of the causes of negative impacts on performancetesting and some quick resolutions that will help smooth everything out. Heap memory utilization. Number of active/daemon threads.
Web performance is a broad subject, and you’ll find no shortage of performancetesting tips and tutorials all over the web. Before you begin tuning your website or application, you must first figure out which metrics matter most to your users and establish some achievable benchmarks. What is PerformanceTesting?
Navigate web application performancetesting with our comprehensive step-by-step approach. From selecting the right tools to grasping essential metrics, we illuminate the path to a high-performing website. As we discussed in this article, performancetesting is a critical part of the software testing process.
Testing is one of those things that you either get super excited about or kinda close your eyes and walk away. Whichever camp you fall into, I’m here to tell you that front-end testing is for everyone. In fact, there are many types of tests and perhaps that is where some of the initial fear or confusion comes from. Integration.
This should do it: I submit the PR with the changes and verify that the deployment was successful in GitHub: Navigating to my SpeedCurve Deployments dashboard, I see that a deploy has automatically been created and it is in queue for testing. I find what I was after when I view the test details for that deployment.
AWS RDS Using Sysbench This article evaluates PostgreSQL’s performance on ScaleGrid and AWS RDS, focusing on versions 13, 14, and 15. We use Sysbench to benchmark key performancemetrics under different workloads and thread configurations, including Transactions Per Second (TPS) and Queries Per Second (QPS).
This was a great example on how powerful the data of Dynatrace is when it comes to detecting performance or scalability issues and their root cause. The metrics are great for anyone in operations and capacity planning. You can test for them before releasing to production and can even simulate chaotic situations, e.g:
Metrics: Numeric representation of data measured over a set period. Analyze how end-users experience the system in terms of average response times, error rates, and other digital experience metrics. Monitor key performancemetrics that can be with interactive visual dashboards.
CD is the next step in the process that automates the delivery of applications to selected infrastructure environments, such as a development environment for a related feature, or testing environments to verify feature functionality and proper integration with other parts of the software. Testing quality improves. Test pass rate.
They offer SSD-based cloud hosting with straightforward pricing as well starting at just $5/month , which makes it ideal (and affordable) for developers to build, test and deploy their new applications seamlessly in the cloud. What’s most impressive is that you’re not compromising performance for cost.
We organize all of the trending information in your field so you don't have to. Join 5,000+ users and stay up to date on the latest articles your peers are reading.
You know about us, now we want to get to know you!
Let's personalize your content
Let's get even more personalized
We recognize your account from another site in our network, please click 'Send Email' below to continue with verifying your account and setting a password.


Let's personalize your content