This site uses cookies to improve your experience. To help us insure we adhere to various privacy regulations, please select your country/region of residence. If you do not select a country, we will assume you are from the United States. Select your Cookie Settings or view our Privacy Policy and Terms of Use.
Cookie Settings
Cookies and similar technologies are used on this website for proper function of the website, for tracking performance analytics and for marketing purposes. We and some of our third-party providers may use cookie data for various purposes. Please review the cookie settings below and choose your preference.
Used for the proper function of the website
Used for monitoring website traffic and interactions
Cookie Settings
Cookies and similar technologies are used on this website for proper function of the website, for tracking performance analytics and for marketing purposes. We and some of our third-party providers may use cookie data for various purposes. Please review the cookie settings below and choose your preference.
Strictly Necessary: Used for the proper function of the website
Performance/Analytics: Used for monitoring website traffic and interactions
Applications and services are often slowed down by under-performing DNS communications or misconfigured DNS servers, which can result in frustrated customers uninstalling your application. Ensure high quality network traffic by tracking DNS requests out-of-the-box. Identify under-performing DNS servers.
Quick and easy network infrastructure monitoring. Begin network monitoring by simply deploying an extension with just a few clicks. The topology model for network devices covers simple to complex use cases from visualizing the interfaces of a router to mapping an F5 Big-IP LTM load balancer. Virtual servers. Pool nodes.
Even if infrastructure metrics aren’t your thing, you’re welcome to join us on this creative journey simply swap out the suggested metrics for ones that interest you. For our example dashboard, we’ll only focus on some selected key infrastructure metrics. Click on Select metric. Change it now to sum.
Why browser and HTTP monitors might not be sufficient In modern IT environments, which are complex and dynamically changing, you often need deeper insights into the Transport or Network layers. Is it a bug in the codebase, a malfunctioning backend service, an overloaded hosting infrastructure, or perhaps a misconfigured network?
Dynatrace has recently extended its Kubernetes operator by adding a new feature, the Prometheus OpenMetrics Ingest , which enables you to import Prometheus metrics in Dynatrace and build SLO and anomaly detection dashboards with Prometheus data. Here we’ll explore how to collect Prometheus metrics and what you can achieve with them.
Time To First Byte: Beyond Server Response Time Time To First Byte: Beyond Server Response Time Matt Zeunert 2025-02-12T17:00:00+00:00 2025-02-13T01:34:15+00:00 This article is sponsored by DebugBear Loading your website HTML quickly has a big impact on visitor experience. But actually, theres a lot more to optimizing this metric.
That is, relying on metrics, logs, and traces to understand what software is doing and where it’s running into snags. When software runs in a monolithic stack on on-site servers, observability is manageable enough. In addition to tracing, observability also defines two other key concepts, metrics and logs. What is OpenTelemetry?
Today’s applications are cloud-native, microservices-based, and extend across both the cloud and on-premises servers. This blog originally appeared in Federal News Network. The post How AI and observability help to safeguard government networks from new threats appeared first on Dynatrace news.
Additional benefits of Dynatrace SaaS on Azure include: No infrastructure investment : Dynatrace manages the infrastructure for you, including automatic visibility, problem detection, and smart alerting across virtual networks, virtual infrastructure, and container orchestration.
Infrastructure monitoring includes automatic visibility, problem detection, and smart alerting across virtual networks, virtual infrastructure, and container orchestration. Monitor additional metrics. Additionally, we’re further extending our infrastructure mode with runtime metrics for: Java.NET. How to get access.
Continuous cloud monitoring with automation provides clear visibility into the performance and availability of websites, files, applications, servers, and network resources. These next-generation cloud monitoring tools present reports — including metrics, performance, and incident detection — visually via dashboards.
Before GraphQL: Monolithic Falcor API implemented and maintained by the API Team Before moving to GraphQL, our API layer consisted of a monolithic server built with Falcor. A single API team maintained both the Java implementation of the Falcor framework and the API Server. To launch Phase 1 safely, we used AB Testing.
Dynatrace provides servermetrics monitoring in under five minutes, showing servers’ CPU, memory, and network health metrics all the way through to the process level, with no manual configuration necessary. AL2023 is supported by Dynatrace on day one and has been thoroughly tested by our installations team.
To keep infrastructure and bare metal servers running smoothly, a long list of additional devices are used, such as UPS devices, rack cases that provide their own cooling, power sources, and other measures that are designed to prevent failures. But manual configuration of observability for systems like this is nearly impossible.
Citrix is a sophisticated, efficient, and highly scalable application delivery platform that is itself comprised of anywhere from hundreds to thousands of servers. Dynatrace Extension: database performance as experienced by the SAP ABAP server. SAP server. It delivers vital enterprise applications to thousands of users.
The F5 BIG-IP Local Traffic Manager (LTM) is an application delivery controller (ADC) that ensures the availability, security, and optimal performance of network traffic flows. The LTM pool members represent your application and web servers, which can be effortlessly monitored with OneAgent ®. Example F5 overview dashboard.
The Qualys Threat Research Unit (TRU) has discovered a Remote Unauthenticated Code Execution (RCE) vulnerability in OpenSSH server (sshd) in glibc-based Linux systems. Analyze network flow logs Last but not least, your network logs are the ultimate source of data. The CVE assigned to this vulnerability is CVE-2024-6387.
Native support for Syslog messages Syslog messages are generated by default in Linux and Unix operating systems, security devices, network devices, and applications such as web servers and databases. Native support for syslog messages extends our infrastructure log support to all Linux/Unix systems and network devices.
These include traditional on-premises network devices and servers for infrastructure applications like databases, websites, or email. A local endpoint in a protected network or DMZ is required to capture these messages. The ultimate challenge lies in making data from syslog-supported log sources actionable.
They collect data from multiple sources through real user monitoring , synthetic monitoring, network monitoring, and application performance monitoring systems. Align business and development teams’ input on what user experience metrics to measure to understand users’ most critical digital experience aspects.
But there’s more than just a need for minimizing resource (CPU, memory, storage) and network (bandwidth) consumption for observability at the edge. Moreover, edge environments can be highly dynamic, with devices frequently joining and leaving the network.
Open Connect Open Connect is Netflix’s content delivery network (CDN). video streaming) takes place in the Open Connect network. The network devices that underlie a large portion of the CDN are mostly managed by Python applications. If any of this interests you, check out the jobs site or find us at PyCon. are you logged in?
I never thought I’d write an article in defence of DOMContentLoaded , but here it is… For many, many years now, performance engineers have been making a concerted effort to move away from technical metrics such as Load , and toward more user-facing, UX metrics such as Speed Index or Largest Contentful Paint. Or are they…?
Are there rogue servers running in the environment where ITOps, CloudOps, or another team can’t assign or identify who’s financially responsible for it? An organization can ask Dynatrace, “Have you seen any oversized servers over X amount of time?” ” But Dynatrace goes further.
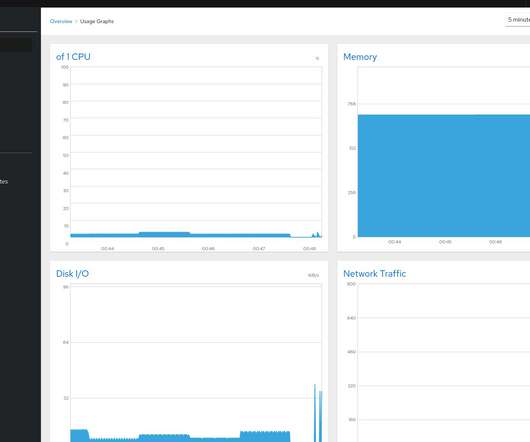
I needed basic information on RAM, CPU, Disk, Networking, and I/O to assess the performance bottleneck for the serve. " I was in the search for a straightforward tool that shows me hardware "VM" metrics and allows me to check the logs without ssh into the VM and ideally tool should be Open Source.
I can reload the exact same page under the exact same network conditions over and over, and I can guarantee I will not get the exact same, say, DOMContentLoaded each time. As noted above, it’s not actually possible to improve certain metrics in their own right. There are myriad reasons for this that I won’t cover here. duration ).
Fast, consistent application delivery creates a positive user experience that can ultimately drive customer loyalty and improve business metrics like conversion rate and user retention. With DEM solutions, organizations can operate over on-premise network infrastructure or private or public cloud SaaS or IaaS offerings.
You will need to know which monitoring metrics for Redis to watch and a tool to monitor these critical servermetrics to ensure its health. Redis returns a big list of database metrics when you run the info command on the Redis shell. You can pick a smart selection of relevant metrics from these.
Making applications observable—relying on metrics, logs, and traces to understand what software is doing and how it’s performing—has become increasingly important as workloads are shifting to multicloud environments. We also introduced our demo app and explained how to define the metrics and traces it uses.
To make this possible, the application code should be instrumented with telemetry data for deep insights, including: Metrics to find out how the behavior of a system has changed over time. And because Dynatrace can consume CloudWatch metrics, almost all your AWS usage information is available to you within Dynatrace.
A standard Docker container can run anywhere, on a personal computer (for example, PC, Mac, Linux), in the cloud, on local servers, and even on edge devices. Running containers : Docker Engine is a container runtime that runs in almost any environment: Mac and Windows PCs, Linux and Windows servers, the cloud, and on edge devices.
We introduced Digital Business Analytics in part one as a way for our customers to tie business metrics to application performance and user experience, delivering unified insights into how these metrics influence business milestones and KPIs. Dynatrace news. But first, a little preparation. Verify the new properties.
Besides the traditional system hardware, storage, routers, and software, ITOps also includes virtual components of the network and cloud infrastructure. A network administrator sets up a network, manages virtual private networks (VPNs), creates and authorizes user profiles, allows secure access, and identifies and solves network issues.
Another benefit of defining custom APIs is that the memory allocation and surviving object metrics are split by each custom API definition. Verification with Dynatrace custom metrics As Dynatrace also exposes key metrics about our message handler via JMX, we can use those metrics to investigate further.
To effectively address such warning signs, organizations need to focus on putting observability data into context—mapping and visualizing relationships and dependencies within all collected telemetry data—not only traces, metrics, and logs. OneAgent implements network zones to create traffic routing rules and limit cross-data-center traffic.
Dynatrace Mission Control collects the health monitoring observability metrics for both our Dynatrace SaaS as well as Dynatrace Managed customers. Metrics are provided for general host info like CPU usage and memory consumption, OneAgent traffic, and network latency. Currently, only metrics for individual nodes are available.
A single OneAgent instance can handle the monitoring of many types of entities, including servers, applications, services, databases, and more. But what if a particular metric that’s crucial to your monitoring needs isn’t covered out of the box? By using these APIs, you can add metrics, events, and logs. extensions.
Enable the Davis AI causation engine to automatically analyze every metric. In response to customer feedback, we’ve distilled the vital information provided within HANA DB performance views down to a short list of metrics that offer comprehensive, detailed, and reliable insights into HANA DB performance.
However, one metric I feel that front-end developers overlook all too quickly is Time to First Byte (TTFB). A lot of people surmise that TTFB is merely time spent on the server, but that is only a small fraction of the true extent of things. The reason is because mobile networks are, as a rule, high latency connections.
We are already working on the support for SUSE Linux Enterprise Server (SLES) which we will be announcing shortly. Host performance is tracked via high-level health metrics on the home dashboard to details for each of the hosts. For details on available metrics, see our help page on host performance monitoring.
As a result, site reliability has emerged as a critical success metric for many organizations. The growing amount of data processed at the network edge, where failures are more difficult to prevent, magnifies complexity. The following three metrics are commonly used to measure success: Service-level agreements (SLAs).
This greatly reduced the number of metrics to manage and provided a more comprehensive picture of what was behind their primary reliability service-level objective. This represents the total number of requests across the network. This refers to the load on your network and servers. Saturation.
As businesses increasingly embrace these technologies, integrating IoT metrics with advanced observability solutions like Dynatrace becomes essential to gaining additional business value through end-to-end observability. Both methods allow you to ingest and process raw data and metrics.
It can be used along with a visualization tool like Grafana to easily create and edit dashboards, query, visualize, alert on, and understand your metrics. These tools will provide additional insight to your metrics, usage patterns, and datasets along with your ScaleGrid MySQL monitoring , query analysis , and alerts.
We organize all of the trending information in your field so you don't have to. Join 5,000+ users and stay up to date on the latest articles your peers are reading.
You know about us, now we want to get to know you!
Let's personalize your content
Let's get even more personalized
We recognize your account from another site in our network, please click 'Send Email' below to continue with verifying your account and setting a password.


Let's personalize your content