This site uses cookies to improve your experience. To help us insure we adhere to various privacy regulations, please select your country/region of residence. If you do not select a country, we will assume you are from the United States. Select your Cookie Settings or view our Privacy Policy and Terms of Use.
Cookie Settings
Cookies and similar technologies are used on this website for proper function of the website, for tracking performance analytics and for marketing purposes. We and some of our third-party providers may use cookie data for various purposes. Please review the cookie settings below and choose your preference.
Used for the proper function of the website
Used for monitoring website traffic and interactions
Cookie Settings
Cookies and similar technologies are used on this website for proper function of the website, for tracking performance analytics and for marketing purposes. We and some of our third-party providers may use cookie data for various purposes. Please review the cookie settings below and choose your preference.
Strictly Necessary: Used for the proper function of the website
Performance/Analytics: Used for monitoring website traffic and interactions
With so many types of technologies in software stacks around the globe, OpenTelemetry has emerged as the de facto standard for gathering telemetry data. Semconv for HTTP Spans quite possibly the most important signal have been declared stable, and HTTP Metrics will hopefully soon follow. OpenTelemetry trends are following suit.
As organizations adopt more cloud-native technologies, the risk—and consequences—of cyberattacks are also increasing. Through this integration, Dynatrace enriches data collected by Microsoft Sentinel to provide organizations with enhanced data insights in context of their full technology stack. Runtime application protection.
On average, organizations use 10 different tools to monitor applications, infrastructure, and user experiences across these environments. Indeed, around 85% of technology leaders believe their problems are compounded by the number of tools, platforms, dashboards, and applications they rely on to manage multicloud environments.
Prometheus is an open-source monitoring and alerting toolkit for services and applications that run in containers. Prometheus collects metrics from a number endpoints that expose metrics in the OpenMetrics format. The Dynatrace AMP extension enables you to easily ingest Prometheus metrics into Dynatrace. Dynatrace news.
In IT and cloud computing, observability is the ability to measure a system’s current state based on the data it generates, such as logs, metrics, and traces. What is the difference between monitoring and observability? Is observability really monitoring by another name? What is observability? In short, no.
Dynatrace OpenPipeline is a new stream processing technology that ingests and contextualizes data from any source. For years, logs have been the dominant approach many observability vendors have taken to report business metrics on dashboards. Business process monitoring and optimization.
We’re proud to announce that Ally Financial has presented Dynatrace with its Ally Technology Velocity with Quality award. This is the second time Ally Financial has presented its Ally Technology Partner Awards. They quickly adopted full-stack monitoring and real user monitoring (RUM).
Building on its advanced analytics capabilities for Prometheus data , Dynatrace now enables you to create extensions based on Prometheus metrics. This allows teams to extend the intelligent observability Dynatrace provides to all technologies that provide Prometheus exporters. Our monitoring coverage already includes ?
The Dynatrace platform automatically captures and maps metrics, logs, traces, events, user experience data, and security signals into a single datastore, performing contextual analytics through a “power of three AI”—combining causal, predictive, and generative AI. It’s about uncovering insights that move business forward.
This trend is prompting advances in both observability and monitoring. But exactly what are the differences between observability vs. monitoring? Monitoring and observability provide a two-pronged approach. To get a better understanding of observability vs monitoring, we’ll explore the differences between the two.
In Part 1 we explored how you can use the Davis AI to analyze your StatsD metrics. In Part 2 we showed how you can run multidimensional analysis for external metrics that are ingested via the OneAgent Metric API. In Part 3 we discussed how the Davis AI can analyze your metrics from scripting languages like Bash or PowerShell.
As we look at today’s applications, microservices, and DevOps teams, we see leaders are tasked with supporting complex distributed applications using new technologies spread across systems in multiple locations. The emerging concepts of working with DevOps metrics and DevOps KPIs have really come a long way. Change failure rate.
Dynatrace has recently extended its Kubernetes operator by adding a new feature, the Prometheus OpenMetrics Ingest , which enables you to import Prometheus metrics in Dynatrace and build SLO and anomaly detection dashboards with Prometheus data. Here we’ll explore how to collect Prometheus metrics and what you can achieve with them.
Real-time monitoring : The periodic reports from cloud service providers lack real-time monitoring and actionable insights, limiting IT teams’ ability to make immediate adjustments to reduce carbon footprints. We implemented a wasted energy metric in the app to enhance practitioner actionability.
In the dynamic world of cloud-native technologies, monitoring and observability have become indispensable. However, managing its health and performance efficiently necessitates a robust monitoring solution. Kubernetes, the de-facto orchestration platform, offers scalability and agility.
already address SNMP, WMI, SQL databases, and Prometheus technologies, serving the monitoring needs of hundreds of Dynatrace customers. JMX monitoring extensions are currently being migrated. are technologically very different, Python and JMX extensions designed for Extension Framework 1.0 Extensions 2.0 Extensions 2.0
As businesses compete for customer loyalty, it’s critical to understand the difference between real-user monitoring and synthetic user monitoring. However, not all user monitoring systems are created equal. What is real user monitoring? RUM gathers information on a variety of performance metrics.
Cloud-native technologies are driving the need for organizations to adopt a more sophisticated IT monitoring approach to satisfy the competitive demands of modern business. Often, these metrics are unable to even identify trends from past to present, never mind helping teams to predict future trends. Operational optimization.
Current synthetic capabilities Dynatrace Synthetic Monitoring is a powerful tool that provides insight into the health of your applications around the clock and as they’re perceived by your end users worldwide. Compared to other solutions I have tested, Dynatrace NAM monitors are the most configurable which is to my liking.
Every company has its own strategy as to which technologies to use. To remain flexible in observing all technologies used in their organization, some companies choose open-source solutions, which allow them to stay vendor-neutral. Micrometer is used for instrumenting both out-of-the-box and custom metrics from Spring Boot applications.
DevOps metrics and digital experience data are critical to this. Bringing teams together around DevOps metrics made it easier for M&B to identify how it could create better digital experiences for its customers and optimize revenue. Dynatrace news. Beginnings of BizDevOps. Why stop at your own virtual walls?
Over the last year, Dynatrace extended its AI-powered log monitoring capabilities by providing support for all log data sources. We added monitoring and analytics for log streams from Kubernetes and multicloud platforms like AWS, GCP, and Azure, as well as the most widely used open-source log data frameworks.
Fast, consistent application delivery creates a positive user experience that can ultimately drive customer loyalty and improve business metrics like conversion rate and user retention. What is digital experience monitoring? Primary digital experience monitoring tools.
These resources generate vast amounts of data in various locations, including containers, which can be virtual and ephemeral, thus more difficult to monitor. These challenges make AWS observability a key practice for building and monitoring cloud-native applications. Serverless technologies can reduce management complexity.
Infrastructure monitoring is the process of collecting critical data about your IT environment, including information about availability, performance and resource efficiency. Many organizations respond by adding a proliferation of infrastructure monitoring tools, which in many cases, just adds to the noise. Dynatrace news.
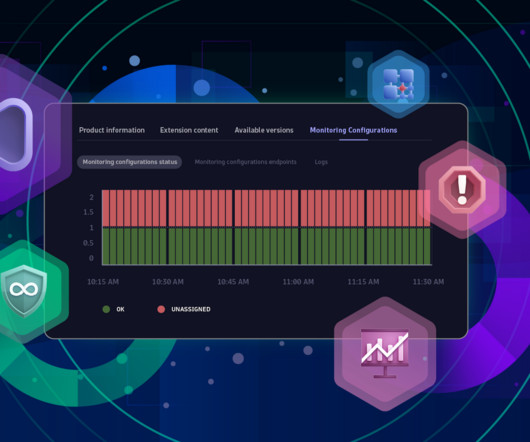
With over 700 ready-made apps and integrations on the Hub, Dynatrace seamlessly automates full stack monitoring, ensuring comprehensive coverage regardless of the technologies you’re utilizing. Search the Hub to find Extensions for effortlessly importing technology-specific metrics. Of course, seeing is believing.
Technology and business leaders express increasing interest in integrating business data into their IT observability strategies, citing the value of effective collaboration between business and IT. Observability fault lines The monitoring of complex and dynamic IT systems includes real-time analysis of baselines, trends, and anomalies.
An hourly rate for Infrastructure Monitoring The Dynatrace Platform Subscription (DPS) offers a flat rate for Infrastructure Monitoring , providing observability for cloud platforms, containers, networks, and data center technologies with no limits on host memory and with AIOps included.
AIOps offers an alternative to traditional infrastructure monitoring and management with end-to-end visibility and observability into IT stacks. But increasing complexity and lacking visibility creates a problem: Enterprises invest more resources into monitoring and don’t get the data and answers they need.
Thousands of new technologies are created and integrated with Dynatrace products every day. Introducing Dynatrace Extensions In short, the Extensions app is the central place for configuring, monitoring, and discovering extensions. You can call upon it to fill any monitoring gaps. Dynatrace already offers the Extensions 2.0
Observability is the new standard of visibility and monitoring for cloud-native architectures. It’s powered by vast amounts of collected telemetry data such as metrics, logs, events, and distributed traces to measure the health of application performance and behavior. Observability brings multicloud environments to heel.
Log monitoring, log analysis, and log analytics are more important than ever as organizations adopt more cloud-native technologies, containers, and microservices-based architectures. What is log monitoring? Log monitoring vs log analytics. Dynatrace news. billion in 2020 to $4.1
This massive migration is critical to organizations’ digital transformation , placing cloud technology front and center and elevating the need for greater visibility, efficiency, and scalability delivered by a unified observability and security platform. Thoughtful reinvestment. Observability with AI and automation.
To get a more granular look into telemetry data, many analysts rely on custom metrics using Prometheus. Named after the Greek god who brought fire down from Mount Olympus, Prometheus metrics have been transforming observability since the project’s inception in 2012.
Every software development team grappling with Generative AI (GenAI) and LLM-based applications knows the challenge: how to observe, monitor, and secure production-level workloads at scale. Production performance monitoring: Service uptime, service health, CPU, GPU, memory, token usage, and real-time cost and performance metrics.
These are two values he shares with DevOps activist Andreas Grabner, who sat down with Hightower at Dynatrace Perform 2022 to talk about taming Kubernetes and the future of cloud-native technologies. If you’re going to have an SLO, you should have a story in mind of why you’re setting up all these alerts and collecting all these metrics.
With the world’s increased reliance on digital services and the organizational pressure on IT teams to innovate faster, the need for DevOps monitoring tools has grown exponentially. But when and how does DevOps monitoring fit into the process? And how do DevOps monitoring tools help teams achieve DevOps efficiency?
These are just a few of the open-source technologies you may encounter as you research observability solutions for managing complex multicloud IT environments and the services that run on them. In fact, these technologies have become so prevalent that anybody who may not know the full scope of the topic may be afraid to ask.
According to InfoQ , Kubernetes monitoring offers substantial benefits for container management, but it’s not a complete platform in and of itself. Kubernetes monitoring from Dynatrace offers a way to bridge the observability gap. In practice, the Dynatrace solution improves Kubernetes monitoring across three key areas: 1.
The five key metrics to improve customer satisfaction To help turn this around, Dynatrace makes available its unified observability platform, which captures all CX interactions and transactions in an automated, intelligent manner – including user session replays. When combined, key metrics will generate an accurate CX index score.
It collects, processes, and outputs log files to and from a wide variety of technologies. All metrics, traces, and real user data are also surfaced in the context of specific events. With Dynatrace, you can create custom metrics based on user-defined log events. So, let’s compare the two approaches for ingesting logs.
In January and February, we spoke with a couple of the top influencers in government technology, including Jamie Holcombe , Chief Information Officer at the United State Patent and Trademark Office [USPTO]; and Dimitris Perdikou , Head of Engineering at the UK Home Office, Migration and Borders.
But this approach introduced new complexity and a need for more advanced cloud monitoring capabilities. Dynatrace’s cloud monitoring capabilities are helping Porsche Informatik to simplify complexity and drive improved digital experiences for customers. Simplifying complexity with cloud monitoring. The key value of Dynatrace.
That is, relying on metrics, logs, and traces to understand what software is doing and where it’s running into snags. In addition to tracing, observability also defines two other key concepts, metrics and logs. When software runs in a monolithic stack on on-site servers, observability is manageable enough. What is OpenTelemetry?
We organize all of the trending information in your field so you don't have to. Join 5,000+ users and stay up to date on the latest articles your peers are reading.
You know about us, now we want to get to know you!
Let's personalize your content
Let's get even more personalized
We recognize your account from another site in our network, please click 'Send Email' below to continue with verifying your account and setting a password.


Let's personalize your content