This site uses cookies to improve your experience. To help us insure we adhere to various privacy regulations, please select your country/region of residence. If you do not select a country, we will assume you are from the United States. Select your Cookie Settings or view our Privacy Policy and Terms of Use.
Cookie Settings
Cookies and similar technologies are used on this website for proper function of the website, for tracking performance analytics and for marketing purposes. We and some of our third-party providers may use cookie data for various purposes. Please review the cookie settings below and choose your preference.
Used for the proper function of the website
Used for monitoring website traffic and interactions
Cookie Settings
Cookies and similar technologies are used on this website for proper function of the website, for tracking performance analytics and for marketing purposes. We and some of our third-party providers may use cookie data for various purposes. Please review the cookie settings below and choose your preference.
Strictly Necessary: Used for the proper function of the website
Performance/Analytics: Used for monitoring website traffic and interactions
Imagine you’re using a lot of OpenTelemetry and Prometheus metrics on a crucial platform. A histogram is a specific type of metric that allows users to understand the distribution of data points over a period of time. Histograms are commonly used to define and monitor service-level objectives (SLOs).
My goal was to provide IT teams with insights to optimize customer experience by collaborating with business teams, using both business KPIs and IT metrics. Recently, we’ve expanded our digital experience monitoring to cover the entire customer journey, from conversion to fulfillment.
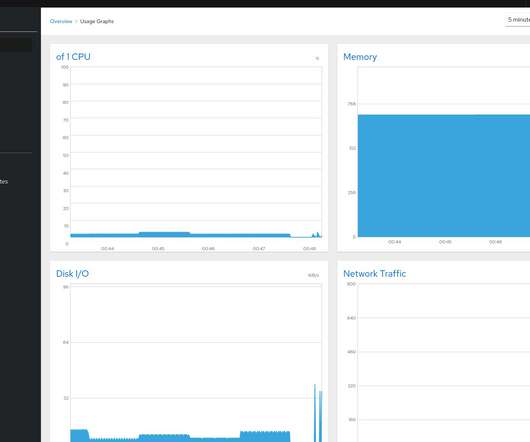
With Dashboards , you can monitor business performance, user interactions, security vulnerabilities, IT infrastructure health, and so much more, all in real time. Follow along to create this host monitoring dashboard We will create a basic Host Monitoring dashboard in just a few minutes. Create a new dashboard.
Digital experience monitoring (DEM) is crucial for organizations to meet this demand and succeed in today’s competitive digital economy. DEM solutions monitor and analyze the quality of digital experiences for users across digital channels.
In fact, according to a Dynatrace global survey of 1,300 CIOs , 99% of enterprises utilize a multicloud environment and seven cloud monitoring solutions on average. What is cloud monitoring? Cloud monitoring is a set of solutions and practices used to observe, measure, analyze, and manage the health of cloud-based IT infrastructure.
Monitor and profile your Spring Boot application! You may also like: Monitoring Using Spring Boot 2.0, Monitoring is very essential for modern applications, modern applications are highly distributed in nature and have different dependencies like database, service, caching and many more.
This trend is prompting advances in both observability and monitoring. But exactly what are the differences between observability vs. monitoring? Monitoring and observability provide a two-pronged approach. To get a better understanding of observability vs monitoring, we’ll explore the differences between the two.
Take your monitoring, data exploration, and storytelling to the next level with outstanding data visualization All your applications and underlying infrastructure produce vast volumes of data that you need to monitor or analyze for insights. That way, you can compare multiple charts more easily, regardless of the metric or time span.
Dynatrace has recently extended its Kubernetes operator by adding a new feature, the Prometheus OpenMetrics Ingest , which enables you to import Prometheus metrics in Dynatrace and build SLO and anomaly detection dashboards with Prometheus data. Here we’ll explore how to collect Prometheus metrics and what you can achieve with them.
As businesses compete for customer loyalty, it’s critical to understand the difference between real-user monitoring and synthetic user monitoring. However, not all user monitoring systems are created equal. What is real user monitoring? RUM gathers information on a variety of performance metrics.
Current synthetic capabilities Dynatrace Synthetic Monitoring is a powerful tool that provides insight into the health of your applications around the clock and as they’re perceived by your end users worldwide. Compared to other solutions I have tested, Dynatrace NAM monitors are the most configurable which is to my liking.
IBM i, formerly known as iSeries, is an operating system developed by IBM for its line of IBM i Power Systems servers. It’s all monitored remotely ! Default dashboard for IBM I monitoring The default dashboard provides an overview of all monitored systems and how many different entities are created by IBM i components.
Fast, consistent application delivery creates a positive user experience that can ultimately drive customer loyalty and improve business metrics like conversion rate and user retention. What is digital experience monitoring? Primary digital experience monitoring tools.
Don’t worry, when it comes to SAP monitoring, Dynatrace has you covered. Dynatrace ActiveGate extensions allow you to integrate Dynatrace monitoring with any remote technology that exposes an interface. Today we’re proud to announce that we’ve extended our SAP monitoring capabilities to support SAP HANA databases.
Anyone moving to the cloud knows that it isn’t just a change from running servers in your data center to running them in someone else’s data center. And that includes infrastructure monitoring. With all this change, thinking about infrastructure monitoring in the same way as you did before is a big mistake. Automatic and easy.
Time To First Byte: Beyond Server Response Time Time To First Byte: Beyond Server Response Time Matt Zeunert 2025-02-12T17:00:00+00:00 2025-02-13T01:34:15+00:00 This article is sponsored by DebugBear Loading your website HTML quickly has a big impact on visitor experience. But actually, theres a lot more to optimizing this metric.
With the world’s increased reliance on digital services and the organizational pressure on IT teams to innovate faster, the need for DevOps monitoring tools has grown exponentially. But when and how does DevOps monitoring fit into the process? And how do DevOps monitoring tools help teams achieve DevOps efficiency?
Many of our customers—the world’s largest enterprises—have embraced the Dynatrace SaaS approach to monitoring, which provides critical business insights powered by AI and automation for globally-distributed, heterogeneous IT landscapes. New self-monitoring environment provides out-of-the-box insights and custom alerting.
Monitoring with ?the Readers who share our privacy concerns, please note, all the data we monitor is publicly available. . The insights in this b log rely heavily on data captured by Dynatrace’s proactive synthetic monitoring capabilities. We ’ve also been monitoring U. the Dynatrace®? seconds to 2.78
As of September 2020, we run 51 clusters on 1100 EC2 instances distributed across six AWS Regions ensuring that all our users can leverage the Dynatrace Software Intelligence Platform to monitor their hybrid-multi cloud environments. Modern hybrid-multicloud monitoring needs more than just metrics.
Prometheus is an open-source monitoring and alerting toolkit for services and applications that run in containers. Prometheus collects metrics from a number endpoints that expose metrics in the OpenMetrics format. The Dynatrace AMP extension enables you to easily ingest Prometheus metrics into Dynatrace. Dynatrace news.
Monitoring Kubernetes is an important aspect of Day 2 o perations and is often perceived as a significant challenge. That’s another example where monitoring is of tremendous help as it provides the current resource consumption picture and help to continuously fine tune those settings. . Monitoring in the Kubernetes world .
Dynatrace OneAgent is great for monitoring the full stack. While this will give you a lot of information about the health of these components, sometimes a simple synthetic monitor is sufficient. Third-party synthetic monitors. Visualize your synthetic monitor data. Easy and flexible infrastructure monitoring.
This has led to the recent release of our new Lambda monitoring extension supporting Node.js, Java, and Python. This extension was built from scratch to take into account all we’ve learned and the special requirements for monitoring ephemeral, auto-scaling, micro VMs like AWS Lambda. A look under the hood of AWS Lambda.
Run your own Video Conference Service with Jitsi , I started looking for a reliable solution to monitor my instance that runs Jitsi. " I was in the search for a straightforward tool that shows me hardware "VM" metrics and allows me to check the logs without ssh into the VM and ideally tool should be Open Source.
With Dynatrace Infrastructure Monitoring you get a complete solution for the monitoring of cloud platforms and virtual infrastructure, along with log monitoring and AIOps. Monitor any infrastructure component and backing service that’s written in Java. Monitor additional metrics. How to get access.
Log monitoring, log analysis, and log analytics are more important than ever as organizations adopt more cloud-native technologies, containers, and microservices-based architectures. A log is a detailed, timestamped record of an event generated by an operating system, computing environment, application, server, or network device.
That is, relying on metrics, logs, and traces to understand what software is doing and where it’s running into snags. When software runs in a monolithic stack on on-site servers, observability is manageable enough. In addition to tracing, observability also defines two other key concepts, metrics and logs. What is OpenTelemetry?
Having released this functionality in a Preview Release back in May 2019, we’re now happy to announce the General Availability of our SAP ABAP monitoring extension. Why SAP ABAP platform monitoring in Dynatrace? As of today, the SAP ABAP application server remains the central component of the SAP ERP solution.
We’re proud to announce the Early Access Program (EAP) for monitoring of SAP ABAP performance from the infrastructure and ABAP application platform perspective. Why SAP ABAP platform monitoring in Dynatrace? As of today, the SAP ABAP application server remains the central component of the SAP ERP solution.
You will need to know which monitoringmetrics for Redis to watch and a tool to monitor these critical servermetrics to ensure its health. Redis returns a big list of database metrics when you run the info command on the Redis shell. You can pick a smart selection of relevant metrics from these.
Wouldn’t it be great if I had an industry-leading software intelligence platform to monitor these apps, pinpoint root causes of slow performance or errors, and gain insights about my users’ experience? At Dynatrace we live and breathe the concept of “Drink Your Own Champagne” (DYOC), so of course, I want to use Dynatrace to monitor my apps.
IT infrastructure is the heart of your digital business and connects every area – physical and virtual servers, storage, databases, networks, cloud services. This shift requires infrastructure monitoring to ensure all your components work together across applications, operating systems, storage, servers, virtualization, and more.
Monitoring your MySQL database performance in real-time helps you immediately identify problems and other factors that could be causing issues now or in the future. This is usually done through monitoring software and tools either built-in to the database management software or installed from third-party providers.
Dynatrace provides servermetricsmonitoring in under five minutes, showing servers’ CPU, memory, and network health metrics all the way through to the process level, with no manual configuration necessary. Auto-detection starts monitoring new virtual machines as they are deployed. How does Dynatrace help?
Serverless computing is a computing model that “allows you to build and run applications and services without thinking about servers.”. If you’re building large applications based on Azure Functions architecture, then Azure Functions monitoring with Dynatrace helps you to: Optimize response-time hotspots. What’s next.
It shows critical SLOs for latency and availability, as well as the most important OpenAI generative AI service metrics, such as response time, error count, and the overall number of requests. OneAgent can automatically monitor all C#,NET, Java, Go, and NodeJS bindings. Our example dashboard below visualizes OpenAI token consumption.
Having released this functionality in a Preview Release back in October 2019, we’re now happy to announce the General Availability of our SAP ABAP real user monitoring. We listened to our customers, and with our recent update, we’ve added real user visibility to our SAP ABAP monitoring extension. Dynatrace news. What you get.
Applications and services are often slowed down by under-performing DNS communications or misconfigured DNS servers, which can result in frustrated customers uninstalling your application. While our competitors only provide generic traffic monitoring without artificial intelligence, Dynatrace automatically analyzes DNS-related anomalies.
Before GraphQL: Monolithic Falcor API implemented and maintained by the API Team Before moving to GraphQL, our API layer consisted of a monolithic server built with Falcor. A single API team maintained both the Java implementation of the Falcor framework and the API Server. To launch Phase 1 safely, we used AB Testing.
Building on its advanced analytics capabilities for Prometheus data , Dynatrace now enables you to create extensions based on Prometheus metrics. Many technologies expose their metrics in the Prometheus data format. Multiple Prometheus servers might be required, creating significant maintenance efforts. and integration with?the?recently
Dynatrace captures all your data, including host and application metrics, basic-network metrics, real-user metrics, mobile metrics, cloud-infrastructure metrics, log metrics, and much more. You must procure hardware, install the OS on the server, install the application, and configure it.
Having released this functionality in an Preview Release back in September 2019, we’re now happy to announce the General Availability of our Citrix monitoring extension. Citrix is a sophisticated, efficient, and highly scalable application delivery platform that is itself comprised of anywhere from hundreds to thousands of servers.
Empowering teams to manage their FinOps practices, however, requires teams to have access to reliable multicloud monitoring and analysis data. Are there rogue servers running in the environment where ITOps, CloudOps, or another team can’t assign or identify who’s financially responsible for it?
We organize all of the trending information in your field so you don't have to. Join 5,000+ users and stay up to date on the latest articles your peers are reading.
You know about us, now we want to get to know you!
Let's personalize your content
Let's get even more personalized
We recognize your account from another site in our network, please click 'Send Email' below to continue with verifying your account and setting a password.


Let's personalize your content