This site uses cookies to improve your experience. To help us insure we adhere to various privacy regulations, please select your country/region of residence. If you do not select a country, we will assume you are from the United States. Select your Cookie Settings or view our Privacy Policy and Terms of Use.
Cookie Settings
Cookies and similar technologies are used on this website for proper function of the website, for tracking performance analytics and for marketing purposes. We and some of our third-party providers may use cookie data for various purposes. Please review the cookie settings below and choose your preference.
Used for the proper function of the website
Used for monitoring website traffic and interactions
Cookie Settings
Cookies and similar technologies are used on this website for proper function of the website, for tracking performance analytics and for marketing purposes. We and some of our third-party providers may use cookie data for various purposes. Please review the cookie settings below and choose your preference.
Strictly Necessary: Used for the proper function of the website
Performance/Analytics: Used for monitoring website traffic and interactions
Migrating Critical Traffic At Scale with No Downtime — Part 1 Shyam Gala , Javier Fernandez-Ivern , Anup Rokkam Pratap , Devang Shah Hundreds of millions of customers tune into Netflix every day, expecting an uninterrupted and immersive streaming experience. This approach has a handful of benefits.
Migrating Critical Traffic At Scale with No Downtime — Part 2 Shyam Gala , Javier Fernandez-Ivern , Anup Rokkam Pratap , Devang Shah Picture yourself enthralled by the latest episode of your beloved Netflix series, delighting in an uninterrupted, high-definition streaming experience. This is where large-scale system migrations come into play.
How To Design For High-Traffic Events And Prevent Your Website From Crashing How To Design For High-Traffic Events And Prevent Your Website From Crashing Saad Khan 2025-01-07T14:00:00+00:00 2025-01-07T22:04:48+00:00 This article is sponsored by Cloudways Product launches and sales typically attract large volumes of traffic.
The Challenge of Title Launch Observability As engineers, were wired to track system metrics like error rates, latencies, and CPU utilizationbut what about metrics that matter to a titlessuccess? Option 1: Log Processing Log processing offers a straightforward solution for monitoring and analyzing title launches.
RabbitMQ can be deployed in distributed environments and includes monitoring tools through a built-in dashboard and CLI. Its partitioned log architecture supports both queuing and publish-subscribe models, allowing it to handle large-scale event processing with minimal latency.
Scaling RabbitMQ ensures your system can handle growing traffic and maintain high performance. Optimizing RabbitMQ performance through strategies such as keeping queues short, enabling lazy queues, and monitoring health checks is essential for maintaining system efficiency and effectively managing high traffic loads.
As businesses compete for customer loyalty, it’s critical to understand the difference between real-user monitoring and synthetic user monitoring. However, not all user monitoring systems are created equal. What is real user monitoring? Real-time monitoring of user application and service interactions.
Over the years we’ve learned from on-call engineers about the pain points of application monitoring: too many alerts, too many dashboards to scroll through, and too much configuration and maintenance. Our streaming teams need a monitoring system that enables them to quickly diagnose and remediate problems; seconds count!
The control group’s traffic utilized the legacy Falcor stack, while the experiment population leveraged the new GraphQL client and was directed to the GraphQL Shim. To determine customer impact, we could compare various metrics such as error rates, latencies, and time to render. After validating performance, we slowly built up scope.
Digital experience monitoring (DEM) allows an organization to optimize customer experiences by taking into account the context surrounding digital experience metrics. What is digital experience monitoring? Primary digital experience monitoring tools.
Highlighting NewReleases For new content, impression history helps us monitor initial user interactions and adjust our merchandising efforts accordingly. This ensures users arent repeatedly shown identical options, keeping the viewing experience vibrant and reducing the risk of frustration or disengagement.
SLOs cover a wide range of monitoring options for different applications. According to the Google Site Reliability Engineering (SRE) handbook, monitoring the four golden signals is crucial in delivering high-performing software solutions. Service-performance template Latency is often described as the time a request takes to be served.
The network latency between cluster nodes should be around 10 ms or less. Near-zero RPO and RTO—monitoring continues seamlessly and without data loss in failover scenarios. Minimized cross-data center network traffic. Achieve high SLOs with seamless monitoring when entire data centers experience outages.
In what follows, we explore some of these best practices and guidance for implementing service-level objectives in your monitored environment. First, it helps to understand that applications and all the services and infrastructure that support them generate telemetry data based on traffic from real users. Define SLOs for each service.
In this blog post, we'll reveal how we leveraged eBPF to achieve continuous, low-overhead instrumentation of the Linux scheduler, enabling effective self-serve monitoring of noisy neighbor issues. Learn how Linux kernel instrumentation can improve your infrastructure observability with deeper insights and enhanced monitoring.
Note : you might hear the term latency used instead of response time. Both latency and response time are critical to ensure reliability. Latency typically refers to the time it takes for a single request to travel from its source to its destination. Latency primarily focuses on the time spent in transit.
By actively monitoring metrics such as error rate, success rate, and CPU load, quality gates instill confidence in teams during software releases. These metrics are latency, traffic, errors, and saturation, all of which must be key considerations when curating user experience. Fewer expensive fixes.
We thus assigned a priority to each use case and sharded event traffic by routing to priority-specific queues and the corresponding event processing clusters. This separation allows us to tune system configuration and scaling policies independently for different event priorities and traffic patterns.
Monitors signals The first attribute of a good SLO is the ability to monitor the four “golden signals”: latency, traffic, error rates, and resource saturation. Dynatrace OneAgent provided information about failure rates, latency, and throughput, along with iOS data for users, crashes, and error rates.
The practice uses continuous monitoring and high levels of automation in close collaboration with agile development teams to ensure applications are highly available and perform without friction. At the lowest level, SLIs provide a view of service availability, latency, performance, and capacity across systems.
We use monitored demo applications to deliver constant load and a defined set of business transactions. While the first guardian validates the traffic, the second guardian checks the business transactions generated during the observation period. The functionality is implemented via an automated workflow.
Organizations have multiple stakeholders and almost always have different teams that set up monitoring, operate systems, and develop new functionality. The monitoring team set up the dashboard, so who owns violations? In their new dashboard, they added dimensions for load, latency, and open problems for each component.
After the jobs are created, it monitors their execution progress. In that scenario, the system would need to deal with the data propagation latency directly, for example, by use of timeouts or client-originated update tracking mechanisms. The cache is kept in sync with the current leader process.
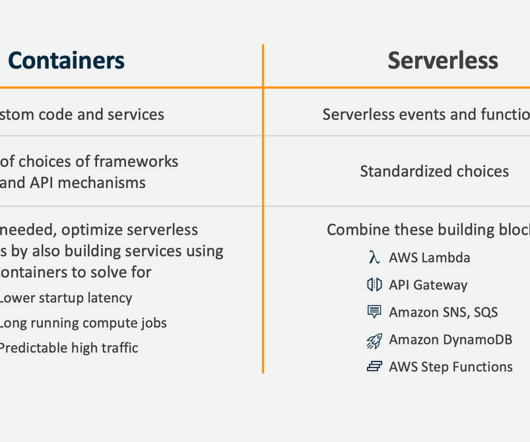
For example, to handle traffic spikes and pay only for what they use. Scale automatically based on the demand and traffic patterns. Higher latency and cold start issues due to the initialization time of the functions. The elasticity of serverless services helps organizations scale as needed.
How viewers are able to watch their favorite show on Netflix while the infrastructure self-recovers from a system failure By Manuel Correa , Arthur Gonigberg , and Daniel West Getting stuck in traffic is one of the most frustrating experiences for drivers around the world. Logs and background requests are examples of this type of traffic.
Effectively assessing and mitigating these external risks requires robust vendor due diligence and continuous monitoring of their cybersecurity posture. By combining technical best practices with DORA technical specifications, Dynatrace creates technical checks to monitor your organization’s security posture.
Rajiv Shringi Vinay Chella Kaidan Fullerton Oleksii Tkachuk Joey Lynch Introduction As Netflix continues to expand and diversify into various sectors like Video on Demand and Gaming , the ability to ingest and store vast amounts of temporal data — often reaching petabytes — with millisecond access latency has become increasingly vital.
You will need to know which monitoring metrics for Redis to watch and a tool to monitor these critical server metrics to ensure its health. This blog post lists the important database metrics to monitor. Effective monitoring of key performance indicators plays a crucial role in maintaining this optimal speed of operation.
Meeting the requirements of a tier-0 application demands the highest level of reliability and scalability, which Dynatrace enables through extensive self-monitoring and self-healing across the entire application stack down to the infrastructure level. Access your cluster health data in Dynatrace Managed.
In addition to providing AI-powered full-stack monitoring capabilities , Dynatrace has long featured broad support for Azure Services and intuitive, native integration with extensions for using OneAgent on Azure. Azure Traffic Manager. Add the new services you’d like to monitor and you’re good to go! Azure Batch.
In case of a spike in traffic, you can automatically spin up more resources, often in a matter of seconds. Likewise, you can scale down when your application experiences decreased traffic. For example, as traffic increases, costs will too. This can dramatically decrease network latency and its effect on the end-user experience.
With that, we could make use of the full set of OpenTelemetry’s features to instrument and monitor our applications in the Dynatrace back end, including traces with spans and metrics. OneAgent is the native telemetry data collector and monitoring solution of Dynatrace.
Note : you might hear the term latency used instead of response time. Both latency and response time are critical to ensure reliability. Latency typically refers to the time it takes for a single request to travel from its source to its destination. Latency primarily focuses on the time spent in transit.
Azure and found that DigitalOcean performance was in line with, if not better, on both high throughput and low latency in the deployment. While adequate for low-traffic applications, small databases, and dev/test environments, we recommend against leveraging shared clusters for your MongoDB production deployments.
Configuration files allow for the automatic creation, update, and management of configurations for dashboards, synthetic monitors, alerts, SLOs, and security settings across multiple environments. Proper notifications or escalations are automated based on ownership information.
Canary Test Workloads In addition to serving the regular message traffic between users and DUTs, the control plane itself is stress-tested at roughly 3-hour intervals, where nearly 3000 ephemeral MQTT clients are created to connect to and generate flash traffic on the MQTT brokers. million elements.
If we had an ID for each streaming session then distributed tracing could easily reconstruct session failure by providing service topology, retry and error tags, and latency measurements for all service calls. Additionally, it became easy to provide deep links to different monitoring and deployment systems in Edgar due to consistent tagging.
Each of these models is suitable for production deployments and high traffic applications, and are available for all of our supported databases, including MySQL , PostgreSQL , Redis™ and MongoDB® database ( Greenplum® database coming soon). This can result in significant cost savings for high traffic applications.
Then they tried to scale it to cope with high traffic and discovered that some of the state transitions in their step functions were too frequent, and they had some overly chatty calls between AWS lambda functions and S3. They state in the blog that this was quick to build, which is the point.
This architecture shift greatly reduced the processing latency and increased system resiliency. We expanded pipeline support to serve our studio/content-development use cases, which had different latency and resiliency requirements as compared to the traditional streaming use case. divide the input video into small chunks 2.
Resource consumption & traffic analysis. What is the network traffic going to be between services we migrate and those that have to stay in the current data center? How much traffic is sent between two processes hosting a certain service? Step 3: Detailed Traffic Dependency Analysis. What’s in your stack?”.
Netflix shares how Amazon EC2 Auto Scaling allows its infrastructure to automatically adapt to changing traffic patterns in order to keep its audience entertained and its costs on target. Netflix runs dozens of stateful services on AWS under strict sub-millisecond tail-latency requirements, which brings unique challenges. Wednesday?—?December
A monitoring tool like Percona Monitoring and Management (PMM) is a popular choice among open source options for effectively monitoring MySQL performance. In this blog, we will explore various MySQL KPIs that are basic and essential to track using monitoring tools like PMM.
The website went online in less than one month and was able to support a 250 percent increase in traffic around the launch of the Aventador J. To meet such large traffic numbers, they need a technology infrastructure that is secure, reliable, and flexible. ENEL is one of the leading energy operators in the world. million unique visits.
We organize all of the trending information in your field so you don't have to. Join 5,000+ users and stay up to date on the latest articles your peers are reading.
You know about us, now we want to get to know you!
Let's personalize your content
Let's get even more personalized
We recognize your account from another site in our network, please click 'Send Email' below to continue with verifying your account and setting a password.


Let's personalize your content