This site uses cookies to improve your experience. To help us insure we adhere to various privacy regulations, please select your country/region of residence. If you do not select a country, we will assume you are from the United States. Select your Cookie Settings or view our Privacy Policy and Terms of Use.
Cookie Settings
Cookies and similar technologies are used on this website for proper function of the website, for tracking performance analytics and for marketing purposes. We and some of our third-party providers may use cookie data for various purposes. Please review the cookie settings below and choose your preference.
Used for the proper function of the website
Used for monitoring website traffic and interactions
Cookie Settings
Cookies and similar technologies are used on this website for proper function of the website, for tracking performance analytics and for marketing purposes. We and some of our third-party providers may use cookie data for various purposes. Please review the cookie settings below and choose your preference.
Strictly Necessary: Used for the proper function of the website
Performance/Analytics: Used for monitoring website traffic and interactions
We’re proud to announce that Dynatrace has been ranked the top innovative company in Austria for 2025. We’re especially honored because we feel this recognition reflects our culture of innovation. Innovating with passion—at scale At Dynatrace, innovation is one of our core values. Top 20 international companies tab.)
We’re excited to announce that Dynatrace has been named a Leader in the inaugural 2024 Gartner® Magic Quadrant™ for Digital Experience Monitoring. Dynatrace digital experience monitoring (DEM) monitors and analyzes the quality of digital experiences for users across digital channels by collecting data from multiple sources.
To get a better idea of OpenTelemetry trends in 2025 and how to get the most out of it in your observability strategy, some of our Dynatrace open-source engineers and advocates picked out the innovations they find most interesting. In 2025, we expect to see the first releases, so youll be able to test out this innovative technology.
These innovations promise to streamline operations, boost efficiency, and offer deeper insights for enterprises using AWS services. By automating OneAgent deployment at the image creation stage, organizations can immediately equip every EC2 instance with real-time monitoring and AI-powered analytics.
Let’s explore how leading organizations have harnessed the power of end-to-end observability—to reduce costs, drive innovation and acceleration, and deliver exceptional experiences for their customers. BT, the UK’s largest mobile and fixed broadband provider, faced this challenge when managing multiple monitoring tools across different teams.
This enables Dynatrace customers to achieve faster time-to-value and accelerate innovation. As a MISA member, we look forward to collaborating with Microsoft and other members to develop best practices, share insights, and drive innovation in cloud-native security.
In today’s rapidly evolving landscape, incorporating AI innovation into business strategies is vital, enabling organizations to optimize operations, enhance decision-making processes, and stay competitive. The annual Google Cloud Next conference explores the latest innovations for cloud technology and Google Cloud.
We’re excited to announce several log management innovations, including native support for Syslog messages, seamless integration with AWS Firehose, an agentless approach using Kubernetes Platform Monitoring solution with Fluent Bit, a new out-of-the-box ingest dashboard, and OpenPipeline ingest improvements.
In todays digital landscape, organizations face intricate challenges that demand more than basic monitoring. This approach enables faster issue resolution, reduces operational visibility gaps, and frees teams to focus on delivering innovative customer experiences. For more information and the full list of winners, see here.
Observability is no longer just for IT Ops Observability is no longer just about monitoring IT systems. A unified observability platform analyzes every transaction, automates responses at the speed of AI, and enables innovation without limitshelping teams move from reactive remediation to proactive optimization.
On average, organizations use 10 different tools to monitor applications, infrastructure, and user experiences across these environments. Clearly, continuing to depend on siloed systems, disjointed monitoring tools, and manual analytics is no longer sustainable.
With the exponential growth our company is experiencing in terms of the increased number of customers and technologies integrating into the platform, we recognized the need for a best of breed, technology agnostic, AI monitoring tool that could consolidate the management of a multi-cloud environment. Faster time to resolution.
Recently, we’ve expanded our digital experience monitoring to cover the entire customer journey, from conversion to fulfillment. Consolidate real-user monitoring, synthetic monitoring, session replay, observability, and business process analytics tools into a unified platform.
Digital experience monitoring (DEM) is crucial for organizations to meet this demand and succeed in today’s competitive digital economy. DEM solutions monitor and analyze the quality of digital experiences for users across digital channels. The time taken to complete the page load.
Cloud-native technologies are driving the need for organizations to adopt a more sophisticated IT monitoring approach to satisfy the competitive demands of modern business. As a result, organizations need to shift toward more sophisticated models of monitoring and managing IT operations. Agility and innovation.
In today’s complex digital landscape, organizations need to be able to scale and innovate in order to compete. The collaborative partner innovation showcased between Dynatrace and its strategic partnerships is a critical piece of enabling growth for our customers. Below are the winners.
Navigate digital infrastructure complexity In today’s rapidly evolving digital environment, organizations face increasing pressure from customers and competitors to deliver faster, more secure innovations. Automation + Synthetic = Perfect match This is why we integrated Synthetic monitoring in Workflows.
With the pace of digital transformation continuing to accelerate, organizations are realizing the growing imperative to have a robust application security monitoring process in place. What are the goals of continuous application security monitoring and why is it important?
In fact, according to a Dynatrace global survey of 1,300 CIOs , 99% of enterprises utilize a multicloud environment and seven cloud monitoring solutions on average. What is cloud monitoring? Cloud monitoring is a set of solutions and practices used to observe, measure, analyze, and manage the health of cloud-based IT infrastructure.
Automatically allocate costs to teams, departments, or apps for full cost-transparency In recent years, the Dynatrace platform expanded with many innovative features covering various use cases, from business insights to software delivery. Support for additional capabilities will be added in the future.
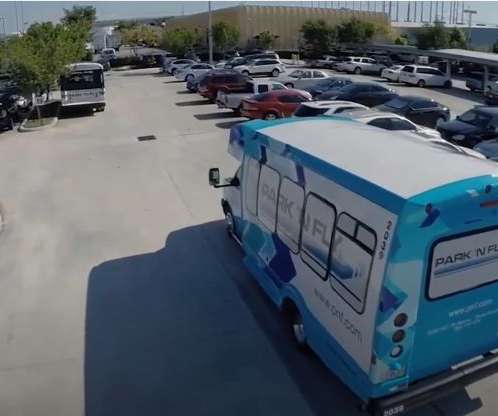
Ultimately, better infrastructure management enables organizations like Park ‘N Fly to innovate through software. To do so, organizations often succumb to a “hamster wheel” of having to release code more quickly to innovate effectively. IT automation speeds code development.
Software should forward innovation and drive better business outcomes. Conversely, an open platform can promote interoperability and innovation. Legacy technologies involve dependencies, customization, and governance that hamper innovation and create inertia. Data supports this need for organizations to flex and modernize.
At the Dynatrace Innovate conference in Barcelona, Bernd Greifeneder, Dynatrace chief technology officer, discussed key examples of how the Dynatrace observability platform delivers value well beyond traditional monitoring. The post Bringing IT automation to life at Dynatrace Innovate Barcelona appeared first on Dynatrace news.
With constraints on IT resources, downtime shifts staff away from innovation and other strategic work. Those hours spent troubleshooting can be spent innovating,” Smith continued. The post State and local agencies speed incident response, reduce costs, and focus on innovation appeared first on Dynatrace news.
Implement proactive monitoring for each of these endpoints. Key Features Proactive monitoring through scheduled collectors jobs Our Title Health microservice runs a scheduled collector job every 30 minutes for most of our personalization stack. Track real-time title impressions from the NetflixUI. there is a dedicated collector.
Infrastructure monitoring is the process of collecting critical data about your IT environment, including information about availability, performance and resource efficiency. Many organizations respond by adding a proliferation of infrastructure monitoring tools, which in many cases, just adds to the noise. Stage 2: Service monitoring.
With the world’s increased reliance on digital services and the organizational pressure on IT teams to innovate faster, the need for DevOps monitoring tools has grown exponentially. But when and how does DevOps monitoring fit into the process? And how do DevOps monitoring tools help teams achieve DevOps efficiency?
When we launched the new Dynatrace experience, we introduced major updates to the platform, including Grail ™, our innovative data lakehouse unifying observability, security, and business data, and Dynatrace Query Language ( DQL ) for accessing and exploring unified data.
Log monitoring, log analysis, and log analytics are more important than ever as organizations adopt more cloud-native technologies, containers, and microservices-based architectures. What is log monitoring? Log monitoring is a process by which developers and administrators continuously observe logs as they’re being recorded.
Organizations can now accelerate innovation and reduce the risk of failed software releases by incorporating on-demand synthetic monitoring as a metrics provider for automatic, continuous release-validation processes. Synthetic monitors can be created with our innovative web recorder or through MONACO , our Monitoring-As-Code approach.
These resources generate vast amounts of data in various locations, including containers, which can be virtual and ephemeral, thus more difficult to monitor. These challenges make AWS observability a key practice for building and monitoring cloud-native applications. AWS monitoring best practices. What is AWS observability?
Dynatrace container monitoring supports customers as they collect metrics, traces, logs, and other observability-enabled data to improve the health and performance of containerized applications. The post Container monitoring for VA Platform One helps VA achieve workload performance appeared first on Dynatrace news.
Metrics on Grail “Metrics are probably the best understood data type in observability ,” says Guido Deinhammer, CPO of infrastructure monitoring at Dynatrace. Traces on Grail Traces are another area where cloud-native technologies have complicated application and microservices monitoring.
This approach has accelerated innovation and created new opportunities for distributed development and support models. Dynatrace is proudly committed to providing users with an integrated observability platform that provides true end-to-end monitoring and analysis.
These criteria include operational excellence, security and data privacy, speed to market, and disruptive innovation. But as a company with a mission to “ Do It Right ” and be a relentless ally for customers and communities, the high-cost monitoring solutions it was using provided only limited insights into end-user experiences.
Option 1: Log Processing Log processing offers a straightforward solution for monitoring and analyzing title launches. This approach embeds observability directly into the very fabric of services managing title launches and personalization, ensuring seamless monitoring and insights.
For most organizations, online service reliability that balances innovation and uptime is a primary goal. SLO monitoring and alerting on SLOs using error-budget burn rates are critical capabilities that can help organizations achieve that goal. What is SLO monitoring? And what is an error budget burn rate?
The PCI DSS framework includes maintaining a secure network, implementing strong access control measures, and regularly monitoring and testing networks. Development teams can innovate with higher quality and deliver better software up to 4x faster.
Dynatrace is proud to provide deep monitoring support for Azure Linux as a container host operating system (OS) platform for Azure Kubernetes Services (AKS) to enable customers to operate efficiently and innovate faster. Why monitor Azure Linux container host for AKS? How Can Dynatrace Monitor Azure Linux container host for AKS?
In today's fast-paced digital landscape, organizations are increasingly embracing multi-cloud environments and cloud-native architectures to drive innovation and deliver seamless customer experiences. They enable developers, engineers, and architects to drive innovation, but they also introduce new challenges."
Every software development team grappling with Generative AI (GenAI) and LLM-based applications knows the challenge: how to observe, monitor, and secure production-level workloads at scale. How can you gain insights that drive innovation and reliability in AI initiatives without breaking the bank?
Although some people may think of observability as a buzzword for sophisticated application performance monitoring (APM) , there are a few key distinctions to keep in mind when comparing observability and monitoring. What is the difference between monitoring and observability? Is observability really monitoring by another name?
Businesses in all sectors are introducing novel approaches to innovate with generative AI in their domains. temperature: 0, max_tokens: 10, }); Once the AI application is started on a OneAgent-monitored server, the application is automatically detected, and the traces and metrics for all outgoing requests are collected.
We organize all of the trending information in your field so you don't have to. Join 5,000+ users and stay up to date on the latest articles your peers are reading.
You know about us, now we want to get to know you!
Let's personalize your content
Let's get even more personalized
We recognize your account from another site in our network, please click 'Send Email' below to continue with verifying your account and setting a password.


Let's personalize your content