This site uses cookies to improve your experience. To help us insure we adhere to various privacy regulations, please select your country/region of residence. If you do not select a country, we will assume you are from the United States. Select your Cookie Settings or view our Privacy Policy and Terms of Use.
Cookie Settings
Cookies and similar technologies are used on this website for proper function of the website, for tracking performance analytics and for marketing purposes. We and some of our third-party providers may use cookie data for various purposes. Please review the cookie settings below and choose your preference.
Used for the proper function of the website
Used for monitoring website traffic and interactions
Cookie Settings
Cookies and similar technologies are used on this website for proper function of the website, for tracking performance analytics and for marketing purposes. We and some of our third-party providers may use cookie data for various purposes. Please review the cookie settings below and choose your preference.
Strictly Necessary: Used for the proper function of the website
Performance/Analytics: Used for monitoring website traffic and interactions
This enables Dynatrace customers to achieve faster time-to-value and accelerate innovation. As a MISA member, we look forward to collaborating with Microsoft and other members to develop best practices, share insights, and drive innovation in cloud-native security.
To get a better idea of OpenTelemetry trends in 2025 and how to get the most out of it in your observability strategy, some of our Dynatrace open-source engineers and advocates picked out the innovations they find most interesting. In 2025, we expect to see the first releases, so youll be able to test out this innovative technology.
In today’s rapidly evolving landscape, incorporating AI innovation into business strategies is vital, enabling organizations to optimize operations, enhance decision-making processes, and stay competitive. The annual Google Cloud Next conference explores the latest innovations for cloud technology and Google Cloud.
With the advent and ingestion of thousands of custom metrics into Dynatrace, we’ve once again pushed the boundaries of automatic, AI-based root cause analysis with the introduction of auto-adaptive baselines as a foundational concept for Dynatrace topology-driven timeseries measurements. In many cases, metric behavior changes over time.
The Dynatrace platform automatically captures and maps metrics, logs, traces, events, user experience data, and security signals into a single datastore, performing contextual analytics through a “power of three AI”—combining causal, predictive, and generative AI. It’s about uncovering insights that move business forward. The result?
As a strategic ISV partner, Dynatrace and Azure are continuously and collaboratively innovating, focusing on a strong build-with motion dedicated to bringing innovative solutions to market to deliver better customer value. Read on to learn more about how Dynatrace and Microsoft leverage AI to transform modern cloud strategies.
We’re excited to announce several log management innovations, including native support for Syslog messages, seamless integration with AWS Firehose, an agentless approach using Kubernetes Platform Monitoring solution with Fluent Bit, a new out-of-the-box ingest dashboard, and OpenPipeline ingest improvements.
In IT and cloud computing, observability is the ability to measure a system’s current state based on the data it generates, such as logs, metrics, and traces. An advanced observability solution can also be used to automate more processes, increasing efficiency and innovation among Ops and Apps teams. What is observability?
When we launched the new Dynatrace experience, we introduced major updates to the platform, including Grail ™, our innovative data lakehouse unifying observability, security, and business data, and Dynatrace Query Language ( DQL ) for accessing and exploring unified data. Next, let’s use the Kubernetes app to investigate more metrics.
When it comes to observing Kubernetes environments, your approach must be rooted in metrics, logs, and traces —and also the context in which things happen and their impact on users. To watch the full session and learn more about how Dynatrace is accelerating innovation with Kubernetes, follow one of the local links below.
My goal was to provide IT teams with insights to optimize customer experience by collaborating with business teams, using both business KPIs and IT metrics. The Dynatrace platform’s granular insights also empower development teams to innovate more effectively so they can deliver faster change, helping executives improve customer experience.
Software should forward innovation and drive better business outcomes. Conversely, an open platform can promote interoperability and innovation. Legacy technologies involve dependencies, customization, and governance that hamper innovation and create inertia. Data supports this need for organizations to flex and modernize.
Customer lifetime value (CLV) has long been established as the key metric financial services firms use to gauge their profitability and competitive position in the market. The growing demand for rapid innovation is worsened by the ongoing skills shortages. This puts sensitive customer and transactional information at risk.
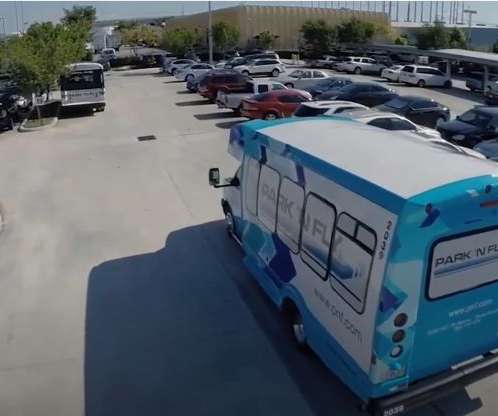
Several team members had to pore through logs, metrics, and other data to identify issues. “We Ultimately, better infrastructure management enables organizations like Park ‘N Fly to innovate through software. To do so, organizations often succumb to a “hamster wheel” of having to release code more quickly to innovate effectively.
The short answer: The three pillars of observability—logs, metrics, and traces—converging on a data lakehouse. You’re getting all the architectural benefits of Grail—the petabytes, the cardinality—with this implementation,” including the three pillars of observability: logs, metrics, and traces in context.
Dynatrace recently opened up the enterprise-grade functionalities of Dynatrace OneAgent to all the data needed for observability, including metrics, events, logs, traces, and topology data. Davis topology-aware anomaly detection and alerting for your custom metrics. Seamlessly report and be alerted on topology-related custom metrics.
How can you gain insights that drive innovation and reliability in AI initiatives without breaking the bank? Amazon Bedrock , equipped with Dynatrace Davis AI and LLM observability , gives you end-to-end insight into the Generative AI stack, from code-level visibility and performance metrics to GenAI-specific guardrails.
This real-time visibility, as well as proven code-level analysis from cloud to the mainframe, gives enterprises a huge competitive advantage—they can eliminate inefficiencies and consequently, innovate at a faster rate. Easily achieve a cost-effective IBM Z configuration by monitoring relevant infrastructure metrics.
Listen in to learn about the innovative steps that the USPTO has taken to develop new ways of working. UK Home Office: Metrics Meets Service with Dimitris Perdikou Follow the Tech Transforms podcast Follow Tech Transforms on Twitter , LinkedIn , Instagram , and Facebook to get the latest updates on new episodes!
However, the drive to innovate faster and transition to cloud-native application architectures generates more than just complexity — it’s creating significant new risk. It also helps to have access to OpenTelemetry, a collection of tools for examining applications that export metrics, logs, and traces for analysis.
Eventually, a previously siloed company can be reorganized as follows: In such a setup, shared high-level metrics drive individual team members to focus on improving customer outcomes, creating more value, and improving the bottom line. In this way, an organization can break through silos and create stronger business outcomes overall.
Loosely defined, observability is the ability to understand what’s happening inside a system from the knowledge of the external data it produces, which are usually logs, metrics, and traces. Logs, metrics, and traces make up the bulk of all telemetry data. The data life cycle has multiple steps from start to finish.
Teams are using concepts from site reliability engineering to create SLO metrics that measure the impact to their customers and leverage error budgets to balance innovation and reliability. Nobl9 integrates with Dynatrace to gather SLI metrics for your infrastructure and applications using real-time monitoring or synthetics.
The Challenge of Title Launch Observability As engineers, were wired to track system metrics like error rates, latencies, and CPU utilizationbut what about metrics that matter to a titlessuccess? Stay tuned for a closer look at the innovation behind thescenes!
While an SLI is just a metric, an SLO just a threshold you expect your SLI to be in and SLA is just the business contract on top of an SLO. Thanks to its event-driven architecture, Keptn can pull SLIs (=metrics) from different data sources and validate them against the SLOs. Together we can drive even more innovation.
Full-stack observability is fast becoming a must-have capability for organizations under pressure to deliver innovation in increasingly cloud-native environments. A full-stack observability solution uses telemetry data such as logs, metrics, and traces to give IT teams insight into application, infrastructure, and UX performance.
Echoing John Van Siclen’s sentiments from his Perform 2020 keynote, Steve cited Dynatrace customers as the inspiration and driving force for these innovations. “A Highlighting the company’s announcements from Perform 2020, Steve and a team of other Dynatrace product leaders introduced the audience to several of our latest innovations.
The primary goals of these campaigns are to encourage more people to install and play the games, making incremental installs and engagement crucial metrics for evaluating their effectiveness. These UA campaigns typically feature static creatives, launch trailers, and game review videos on platforms like Google, Meta, and TikTok.
These vendors didn’t have a lot of incentive to innovate or compete, because they had instrumented such effective mousetraps to lock users in. They spoke their protocols and collected their metrics, and there was no standardization.
This traditional approach presents key performance metrics in an isolated and static way, providing little or no insight into the business impact or progress toward the goals systems support. Often, these metrics are unable to even identify trends from past to present, never mind helping teams to predict future trends.
In addition to automatic full-stack monitoring, Dynatrace provides comprehensive support for all AWS services that publish metrics to Amazon CloudWatch, providing advanced observability for dynamic hybrid clouds. Fully automated: With zero-touch configuration and continuous discovery and mapping, you’ll have more time to innovate.
These criteria include operational excellence, security and data privacy, speed to market, and disruptive innovation. The innovation is mutual The Ally Technology Partner Awards are a way for the company to acknowledge its exceptional partners. “We Dynatrace is especially proud to support innovators like Ally Financial.
The IDC FutureScape: Worldwide IT Industry 2020 Predictions highlights key trends for IT industry-wide technology adoption for the next five years and includes these predictions: Hasten to innovation. By 2024, over 50% of all IT spending will be directly put towards digital transformation and innovation (up from 31% in 2018).
Today, the AI Breakthrough Awards announced its 2020 winners , recognizing the leading AI innovators and solutions. Dynatrace automatically collects data not just from metrics, traces, and logs, but also user experience and code-level insights – all in context and mapped into a topology.
Azure Native Dynatrace Service allows easy access to new Dynatrace platform innovations Dynatrace has long offered deep integration into Azure and Azure Marketplace with its Azure Native Dynatrace Service, developed in collaboration with Microsoft. There’s no need for configuration or setup of any infrastructure.
Dynatrace full stack observability for Red Hat OpenShift Dynatrace enhances software quality and operational efficiency, which drives innovation by unifying application, operation, and platform engineering teams on a single platform. You can automatically detect and analyze performance issues across your entire tech stack with Davis® AI.
Logs can include a wide variety of data, including system events, transaction data, user activities, web browser logs, errors, and performance metrics. This innovative service is transforming the way organizations handle their log data. In today's cloud computing world, all types of logging data are extremely valuable.
Cloud-native observability for Google’s fully managed GKE Autopilot clusters demands new methods of gathering metrics, traces, and logs for workloads, pods, and containers to enable better accessibility for operations teams. Managed Kubernetes clusters on GKE Autopilot have gained unprecedented momentum among enterprises.
To measure service quality, IT teams monitor infrastructure, applications, and user experience metrics, which in turn often support service level objectives (SLO)s. But these metrics and SLOs are only indirectly connected to business KPIs, which often leads to misplaced priorities, ineffective collaboration, and lost business opportunities.
In turn, this drives the need for increased integration of heterogeneous telemetry data such as metrics, logs, and traces, and intelligent awareness of context across disparate data types. It enables organizations to benefit from collective innovation for common tasks so they can concentrate on building their own IP.
Organizations can now accelerate innovation and reduce the risk of failed software releases by incorporating on-demand synthetic monitoring as a metrics provider for automatic, continuous release-validation processes. This metric indicates how quickly software can be released to production. Dynatrace news.
From a cost perspective, internal customers waste valuable time sending tickets to operations teams asking for metrics, logs, and traces to be enabled. A team looking for metrics, traces, and logs no longer needs to file a ticket to get their app monitored in their own environments. This approach is costly and error prone.
Reinvesting resource savings into new technologies built for sustainability, innovation, and efficiency ensures that enterprises are equipped with the tools to enable greater business continuity and accelerate growth. The speed of change is only going to accelerate, thus requiring more innovation. Observability with AI and automation.
Every service and component exposes observability data (metrics, logs, and traces) that contains crucial information to drive digital businesses. The “three pillars of observability,” metrics, logs, and traces, still don’t tell the whole story. Manual troubleshooting is painful, hurts the business, and slows down innovation.
We organize all of the trending information in your field so you don't have to. Join 5,000+ users and stay up to date on the latest articles your peers are reading.
You know about us, now we want to get to know you!
Let's personalize your content
Let's get even more personalized
We recognize your account from another site in our network, please click 'Send Email' below to continue with verifying your account and setting a password.


Let's personalize your content