This site uses cookies to improve your experience. To help us insure we adhere to various privacy regulations, please select your country/region of residence. If you do not select a country, we will assume you are from the United States. Select your Cookie Settings or view our Privacy Policy and Terms of Use.
Cookie Settings
Cookies and similar technologies are used on this website for proper function of the website, for tracking performance analytics and for marketing purposes. We and some of our third-party providers may use cookie data for various purposes. Please review the cookie settings below and choose your preference.
Used for the proper function of the website
Used for monitoring website traffic and interactions
Cookie Settings
Cookies and similar technologies are used on this website for proper function of the website, for tracking performance analytics and for marketing purposes. We and some of our third-party providers may use cookie data for various purposes. Please review the cookie settings below and choose your preference.
Strictly Necessary: Used for the proper function of the website
Performance/Analytics: Used for monitoring website traffic and interactions
This year’s AWS re:Invent will showcase a suite of new AWS and Dynatrace integrations designed to enhance cloud performance, security, and automation. This is particularly valuable for enterprises deeply invested in VMware infrastructure, as it enables them to fully harness the advantages of cloud computing.
Today, users' expectations of seamless performance mean the system cannot afford downtime or disruption that might turn into losses in revenue and reputation. Indeed, chaos engineering is an innovation concerning testing infrastructure resilience these days.
As modern multicloud environments become more distributed and complex, having real-time insights into applications and infrastructure while keeping data residency in local markets is crucial. Optimized performance and enhanced customer experiences. The result?
To maintain system health and resolve issues quickly, teams must have reliable monitoring and performance insights across both Linux and Windows nodes within a single Kubernetes cluster. With Dynatrace, you can trace requests and monitor application performance end-to-end, no matter what OS the workloads run on.
This subscription model offers the flexibility to deploy Dynatrace even more broadly to gain greater visibility into system performance, improve the ability to detect and prevent bottlenecks, and quickly detect and diagnose problems. This means your data point volume is available for all Infrastructure-monitored hosts in your environment.
Infrastructure and operations teams must maintain infrastructure health for IT environments. Any problem, such as a simple software update overburdening a critical database, can cause a ripple effect that degrades the performance of dependent services or applications.
This counting service, built on top of the TimeSeries Abstraction, enables distributed counting at scale while maintaining similar low latency performance. However, this category requires near-immediate access to the current count at low latencies, all while keeping infrastructure costs to a minimum.
CDNs play a crucial role in enhancing website performance and user experience. However, the extended infrastructure of CDNs requires diligent monitoring to ensure optimal performance and identify potential issues. What Is CDN Observability?
Whether you’re a seasoned IT expert or a marketing professional looking to improve business performance, understanding the data available to you is essential. With Dashboards , you can monitor business performance, user interactions, security vulnerabilities, IT infrastructure health, and so much more, all in real time.
The methodology and algorithms were designed by Dynatrace with guidance from the Sustainable Digital Infrastructure Alliance (SDIA), expanding on formulas from the open source project Cloud Carbon Footprint. These optimizations might sound similar if you’re acquainted with Application Performance Management (APM) best practices.
On average, organizations use 10 different tools to monitor applications, infrastructure, and user experiences across these environments. Find and prevent application performance risks A major challenge for DevOps and security teams is responding to outages or poor application performance fast enough to maintain normal service.
Why Is Kubernetes Performance Tuning Needed? As Kubernetes becomes a basic infrastructure for many organizations, performance tuning for Kubernetes clusters is becoming more important. Image Source. Kubernetes is a highly scalable open-source platform for orchestrating containerized workloads in server environments.
The importance of critical infrastructure and services While digital government is necessary, protecting critical infrastructure and services is equally important. Critical infrastructure and services refer to the systems, facilities, and assets vital for the functioning of society and the economy.
Dynatrace provides deep insights into application runtime, offering a detailed view of how applications perform and where potential vulnerabilities might lie. On the other hand, Tenable focuses on infrastructure, conducting comprehensive scans of hosts, web applications, and compliance checks.
Dynatrace integrates application performance monitoring (APM), infrastructure monitoring, and real-user monitoring (RUM) into a single platform, with its Foundation & Discovery mode offering a cost-effective, unified view of the entire infrastructure, including non-critical applications previously monitored using legacy APM tools.
Building performant services and systems is at the core of every business. Tons of technologies emerge daily, promising capabilities that help you surpass your performance benchmarks. However, production environments are chaotic landscapes that exact a heavy performance toll when not maintained and monitored.
With the rise of microservices architecture , there has been a rapid acceleration in the modernization of legacy platforms, leveraging cloud infrastructure to deliver highly scalable, low-latency, and more responsive services. Traditional blocking architectures often struggle to keep up performance, especially under high load.
On top of this, organizations are often unable to accurately identify root causes across their dispersed and disjointed infrastructure. For this reason, end-to-end observability that offers a holistic understanding of problems and their impact on application performance is rising in prevalence across organizations of all sizes and industries.
As HTTP and browser monitors cover the application level of the ISO /OSI model , successful executions of synthetic tests indicate that availability and performance meet the expected thresholds of your entire technological stack. Combined with Dynatrace OneAgent ® , you gain a precise view of the status of your systems at a glance.
As deep learning models evolve, their growing complexity demands high-performance GPUs to ensure efficient inference serving. Many organizations rely on cloud services like AWS, Azure, or GCP for these GPU-powered workloads, but a growing number of businesses are opting to build their own in-house model serving infrastructure.
This is an article from DZone's 2023 Observability and Application Performance Trend Report. Overlooking the nuances of the system state — spanning infrastructure, application performance, and user interaction — is a risk businesses can't afford.
Take your monitoring, data exploration, and storytelling to the next level with outstanding data visualization All your applications and underlying infrastructure produce vast volumes of data that you need to monitor or analyze for insights. Infrastructure health: A honeycomb chart is often used to visualize infrastructure health.
However, it can be difficult to manage and keep an eye on the intricate infrastructure of cloud environments. With the help of these potent tools, businesses can monitor the performance, availability, and security of their cloud resources in real-time. Tools for monitoring the cloud in this situation are useful.
Provide an at-a-glance view of your system’s health and performance Dynatrace guides you in quickly getting the most valuable SLOs set up in just a few clicks. Dedicated management makes it easy to maintain and run your SLOs, while highly customizable dashboard tiles allow you to integrate SLOs with your health and performance overview stats.
For cloud operations teams, network performance monitoring is central in ensuring application and infrastructureperformance. Network performance monitoring core to observability For these reasons, network activity becomes a key data source in IT observability.
Ensuring smooth operations is no small feat, whether you’re in charge of application performance, IT infrastructure, or business processes. Using a seasonal baseline, you can monitor sales performance based on the past fourteen days. In application performance management, acting with foresight is paramount.
The Dynatrace platform automatically captures and maps metrics, logs, traces, events, user experience data, and security signals into a single datastore, performing contextual analytics through a “power of three AI”—combining causal, predictive, and generative AI. What’s behind it all?
But as with many other automation tools, it can be difficult to maintain the performance and visibility of these workflows. Everyone involved in the software delivery lifecycle can work together more effectively with a single source of truth and a shared understanding of pipeline performance and health.
If you are a.NET developer, you must be aware of the importance of optimizing functionality and performance in delivering high-quality software. By using the provided resources adeptly and reducing the website load time, you are not only creating a pleasing experience for users, but it will also reduce infrastructure costs.
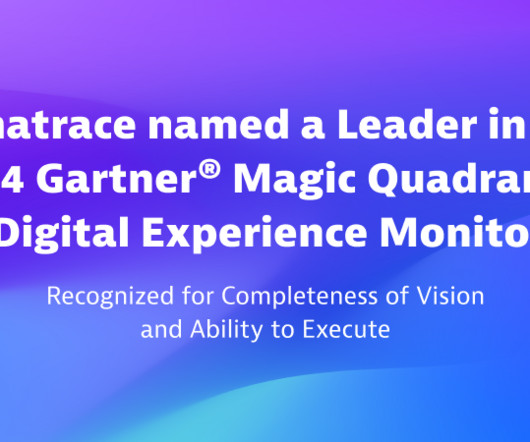
We believe this recognition underscores our dedication to empowering organizations to achieve outstanding digital performance. 5), Hybrid Infrastructure/Platform Operations (4.25/5), We’re excited to announce that Dynatrace has been named a Leader in the inaugural 2024 Gartner® Magic Quadrant™ for Digital Experience Monitoring.
These are just some of the topics being showcased at Perform 2023 in Las Vegas. Perform 2023 news At Perform 2023 in Las Vegas, the headliner theme is IT automation. Operations teams can monitor user experience in cloud infrastructure and automatically provision resources to optimize digital customer experience.
Service-level objectives (SLOs) can play a vital role in ensuring that all stakeholders have visibility into the resources being used and the performance of their applications. If your team is responsible for setting up Kubernetes clusters, you might want to monitor and optimize the workload performance when setting up SLOs.
Configuration and Compliance , adding the configuration layer security to both applications and infrastructure and connecting it to compliance. Dynatrace for Executives Register for the upcoming Dynatrace Perform in February 2025!
Bridging Hardware and Software for Optimal Performance One of VES's core strengths lies in its ability to bridge the gap between hardware and software, creating solutions that maximize performance and efficiency.
A central element of platform engineering teams is a robust Internal Developer Platform (IDP), which encompasses a set of tools, services, and infrastructure that enables developers to build, test, and deploy software applications. BlackDuck performs a security and vulnerability check, returning a scan result.
Mobile applications (apps) are an increasingly important channel for reaching customers, but the distributed nature of mobile app platforms and delivery networks can cause performance problems that leave users frustrated, or worse, turning to competitors. What is mobile app performance? Issue remediation.
This article outlines the key differences in architecture, performance, and use cases to help determine the best fit for your workload. Architecture Comparison RabbitMQ and Kafka have distinct architectural designs that influence their performance and suitability for different use cases.
Dynatrace OTel Collector Understand your applications with ease Due to a lack of contextual insights and actionable intelligence, application teams often find themselves overwhelmed by data, unable to quickly identify the root causes of performance issues.
Secondly, determining the correct allocation of resources (CPU, memory, storage) to each virtual machine to ensure optimal performance without over-provisioning can be difficult. This presents a challenge for IT operations teams, specifically in identifying and addressing performance issues or planning how to prevent future issues.
Benefits of Caching Improved performance: Caching eliminates the need to retrieve data from the original source every time, resulting in faster response times and reduced latency. Reduced server load: By serving cached content, the load on the server is reduced, allowing it to handle more requests and improving overall scalability.
With more organizations taking the multicloud plunge, monitoring cloud infrastructure is critical to ensure all components of the cloud computing stack are available, high-performing, and secure. APM provides real-time visibility into the status and performance of applications. predict and prevent security breaches and outages.
Matthew Liste, Head of Infrastructure at American Express, shared insights at QCon London 2025 on building robust cloud platforms in financial services.
In these modern environments, every hardware, software, and cloud infrastructure component and every container, open-source tool, and microservice generates records of every activity. In a monitoring scenario, you typically preconfigure dashboards that are meant to alert you to performance issues you expect to see later.
Netflix Hybrid Infrastructure : Netflix has invested in a hybrid infrastructure, a mix of cloud-based and physically distributed capabilities operating in multiple locations across the world and close to our productions to optimize user performance. So what isit?
We organize all of the trending information in your field so you don't have to. Join 5,000+ users and stay up to date on the latest articles your peers are reading.
You know about us, now we want to get to know you!
Let's personalize your content
Let's get even more personalized
We recognize your account from another site in our network, please click 'Send Email' below to continue with verifying your account and setting a password.


Let's personalize your content