This site uses cookies to improve your experience. To help us insure we adhere to various privacy regulations, please select your country/region of residence. If you do not select a country, we will assume you are from the United States. Select your Cookie Settings or view our Privacy Policy and Terms of Use.
Cookie Settings
Cookies and similar technologies are used on this website for proper function of the website, for tracking performance analytics and for marketing purposes. We and some of our third-party providers may use cookie data for various purposes. Please review the cookie settings below and choose your preference.
Used for the proper function of the website
Used for monitoring website traffic and interactions
Cookie Settings
Cookies and similar technologies are used on this website for proper function of the website, for tracking performance analytics and for marketing purposes. We and some of our third-party providers may use cookie data for various purposes. Please review the cookie settings below and choose your preference.
Strictly Necessary: Used for the proper function of the website
Performance/Analytics: Used for monitoring website traffic and interactions
The nirvana state of system uptime at peak loads is known as “five-nines availability.” In its pursuit, IT teams hover over system performance dashboards hoping their preparations will deliver five nines—or even four nines—availability. How can IT teams deliver system availability under peak loads that will satisfy customers?
Protecting IT infrastructure, applications, and data requires that you understand security weaknesses attackers can exploit. Vulnerability assessment is the process of identifying, quantifying, and prioritizing the cybersecurity vulnerabilities in a given IT system. Dynatrace news. Identify vulnerabilities. Assess risk.
Kubernetes has taken over the container management world and beyond , to become what some say the operatingsystem or the new Linux of the cloud. But the re’s a price to pay ; an increasing complexity and burden for the operations teams in charge of managing the platform. Dynatrace news. Need help getting started?
In this blog post, youll learn how Dynatrace OneAgent automatically identifies Journald and ingests structured logs into Dynatrace while enriching them with topology and infrastructure context. Journald provides unified structured logging for systems, services, and applications, eliminating the need for custom parsing for severity or details.
IT infrastructure is the heart of your digital business and connects every area – physical and virtual servers, storage, databases, networks, cloud services. We’ve seen the IT infrastructure landscape evolve rapidly over the past few years. What is infrastructure monitoring? . Dynatrace news.
Findings provide insights into Kubernetes practitioners’ infrastructure preferences and how they use advanced Kubernetes platform technologies. As Kubernetes adoption increases and it continues to advance technologically, Kubernetes has emerged as the “operatingsystem” of the cloud. Kubernetes moved to the cloud in 2022.
Infrastructure as code is a way to automate infrastructure provisioning and management. In this blog, I explore how Dynatrace has made cloud automation attainable—and repeatable—at scale by embracing the principles of infrastructure as code. Infrastructure-as-code. But how does it work in practice?
At Dynatrace, we’re constantly striving to come up with solutions that help you better understand the health of your infrastructure. These services are responsible for core components of the Windows operatingsystem and third-party applications. Windows-based infrastructure monitoring. They can be paused and restarted.
Log management is an organization’s rules and policies for managing and enabling the creation, transmission, analysis, storage, and other tasks related to IT systems’ and applications’ log data. Most infrastructure and applications generate logs. How log management systems optimize performance and security. Watch webinar now!
Organizations running these ESXi versions should prioritize implementing the recommended patches or mitigations to protect their virtualization infrastructure from these significant security threats. Check your Definitions database version: Go to Menu > System Settings. Navigate to System Settings. Sign in to Dynatrace VSPM.
To make this possible, the application code should be instrumented with telemetry data for deep insights, including: Metrics to find out how the behavior of a system has changed over time. Traces help find the flow of a request through a distributed system. OneAgent and its Operator . Monitoring your i nfrastructure.
This blog post explains how Dynatrace simplifies log ingestion, whether youre onboarding logs from your infrastructure using OneAgent, cloud services using log forwarding, or driving open-source standardization leveraging OpenTelemetry (OTel), Fluent Bit, or any other API-based ingestion methods.
With the availability of Linux on IBM Z and LinuxONE, the IBM Z platform brings a familiar host operatingsystem and sustainability that could yield up to 75% energy reduction compared to x86 servers. Deploying your critical applications on additional host operatingsystems increases the dependencies for observability.
The system is inconsistent, slow, hallucinatingand that amazing demo starts collecting digital dust. Two big things: They bring the messiness of the real world into your system through unstructured data. When your system is both ingesting messy real-world data AND producing nondeterministic outputs, you need a different approach.
In other words, it includes sharing services like programming, infrastructure, platforms, and software on-demand on the cloud via the internet. The entire process of Cloud Testing is operated online with the help of the required infrastructure.
Kubernetes traces its roots back to Google’s internal Borg and Omega cluster management systems from the early 2000s. ” He credits this shift to the early days of the DevOps movement when infrastructure was built more as code but was still tied to individual machines.
These containers are software packages that include all the relevant dependencies needed to run software on any system. Container-based software isn’t tied to a platform or operatingsystem, so IT teams can move or reconfigure processes easily. Process portability. Faster deployment. CaaS vs. PaaS.
Container orchestration allows an organization to digitally transform at a rapid clip without getting bogged down by slow, siloed development, difficult scaling, and high costs associated with optimizing application infrastructure. Its inherent complexity makes observability difficult — especially when used across highly distributed systems.
Containers enable developers to package microservices or applications with the libraries, configuration files, and dependencies needed to run on any infrastructure, regardless of the target system environment. This means organizations are increasingly using Kubernetes not just for running applications, but also as an operatingsystem.
As we did with IBM Power , we’re delighted to share that IBM and Dynatrace have joined forces to bring the Dynatrace Operator, along with the comprehensive capabilities of the Dynatrace platform, to Red Hat OpenShift on the IBM Z and LinuxONE architecture (s390x).
A log is a detailed, timestamped record of an event generated by an operatingsystem, computing environment, application, server, or network device. Logs can include data about user inputs, system processes, and hardware states. Optimized system performance. What is log monitoring? Log monitoring vs log analytics.
IBM i, formerly known as iSeries, is an operatingsystem developed by IBM for its line of IBM i Power Systems servers. It is based on the IBM AS/400 system and is known for its reliability, scalability, and security features. The extension runs remotely from your Dynatrace ActiveGates and connects to your IBM i system.
Hyper-V plays a vital role in ensuring the reliable operations of data centers that are based on Microsoft platforms. Microsoft Hyper-V is a virtualization platform that manages virtual machines (VMs) on Windows-based systems. Optimize resource allocation, identify bottlenecks, and improve overall system performance.
Available directly from the AWS Marketplace , Dynatrace provides full-stack observability and AI to help IT teams optimize the resiliency of their cloud applications from the user experience down to the underlying operatingsystem, infrastructure, and services. How does Dynatrace help?
It offers automated installation, upgrades, and lifecycle management throughout the container stack – the operatingsystem, Kubernetes and cluster services, and applications – on any cloud. OpenShift and Kubernetes simplify access to underlying infrastructure and help manage the application lifecycle and development workflows.
Oracle Database is a commercial, proprietary multi-model database management system produced by Oracle Corporation, and the largest relational database management system (RDBMS) in the world. Compare ease of use across compatibility, extensions, tuning, operatingsystems, languages and support providers. PostgreSQL.
Monolithic applications earned their name because their structure is a single running application, which often shares the same physical infrastructure. When an application runs on a single large computing element, a single operatingsystem can monitor every aspect of the system. Let’s break it down.
IT operations analytics is the process of unifying, storing, and contextually analyzing operational data to understand the health of applications, infrastructure, and environments and streamline everyday operations. Here are the six steps of a typical ITOA process : Define the data infrastructure strategy.
Dynatrace is proud to provide deep monitoring support for Azure Linux as a container host operatingsystem (OS) platform for Azure Kubernetes Services (AKS) to enable customers to operate efficiently and innovate faster. Microsoft initially designed the OS for internal use to develop and manage Azure services.
Native support for Syslog messages Syslog messages are generated by default in Linux and Unix operatingsystems, security devices, network devices, and applications such as web servers and databases. Native support for syslog messages extends our infrastructure log support to all Linux/Unix systems and network devices.
Traditional computing models rely on virtual or physical machines, where each instance includes a complete operatingsystem, CPU cycles, and memory. There is no need to plan for extra resources, update operatingsystems, or install frameworks. The provider is essentially your system administrator.
Modern observability and security require comprehensive access to your hosts, processes, services, and applications to monitor system performance, conduct live debugging, and ensure application security protection. It automatically discovers and monitors each host’s applications, services, processes, and infrastructure components.
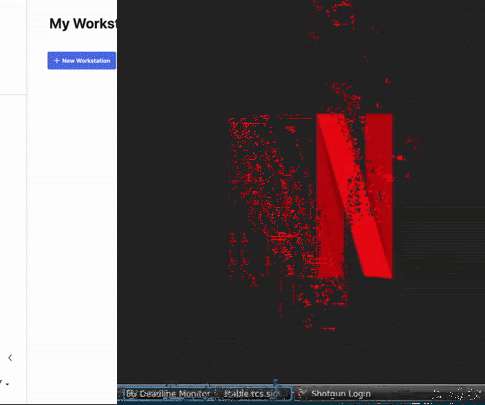
To meet this need, the Studio Infrastructure team has created Netflix Workstations. We needed a system that could manage hundreds to one-day thousands of workstations. We use Salt to make operatingsystem agnostic declarative statements about how to configure a workstation. How did we get here?
It offers automated installation, upgrades, and lifecycle management throughout the container stack – the operatingsystem, Kubernetes and cluster services, and applications – on any cloud. OpenShift and Kubernetes simplify access to underlying infrastructure and help manage the application lifecycle and development workflows.
Nevertheless, there are related components and processes, for example, virtualization infrastructure and storage systems (see image below), that can lead to problems in your Kubernetes infrastructure. Configuring storage in Kubernetes is more complex than using a file system on your host.
Metrics to find out how the behavior of a system has changed over time . Traces help find the flow of a request through a distributed system . To provide actionable answers monitoring systems store, baseline, and analyze telemetry data. Further reading about infrastructure monitoring: .
Its ability to densely schedule containers into the underlying machines translates to low infrastructure costs. JVM, databases, middleware, operatingsystem, cloud instances, etc) by also taking advantage of Dynatrace full-stack observability. That is because Kubernetes provides several benefits from a performance perspective.
set-system-logs-access-enabled. You can now use the oneagentctl command line interface to control OneAgent auto-injection into processes for JMX/PMI extensions in Infrastructure Monitoring mode. Current Dynatrace OneAgent operatingsystems support changes. Future Dynatrace OneAgent operatingsystems support changes.
Current Operatingsystems support changes. The following operatingsystems will no longer be supported starting 01 August 2020. Upcoming Operatingsystems support changes. The following operatingsystems will no longer be supported starting 01 November 2020. infrastructure monitoring solution.
As organizations continue to modernize their technology stacks, many turn to Kubernetes , an open source container orchestration system for automating software deployment, scaling, and management. In fact, more than half of organizations use Kubernetes in production. “Additionally, we are full-stack and goal-oriented.
Think of containers as the packaging for microservices that separate the content from its environment – the underlying operatingsystem and infrastructure. It becomes immediately clear there must be number of mechanisms in place to coordinate such a distributed system.
Migrating bare-metal infrastructure and supported applications to the cloud with no downtime. Time to value is the main consideration for scenarios like: Setting up full-stack monitoring for a large, new Dynatrace environment where data analysis is required within a few hours. Setting up Dynatrace monitoring of a new data center right away.
A distributed storage system is foundational in today’s data-driven landscape, ensuring data spread over multiple servers is reliable, accessible, and manageable. This guide delves into how these systems work, the challenges they solve, and their essential role in businesses and technology.
User demographics , such as app version, operatingsystem, location, and device type, can help tailor an app to better meet users’ needs and preferences. By analyzing trends in resource consumption and performance metrics, developers can predict future needs and plan for capacity upgrades or infrastructure changes.
We organize all of the trending information in your field so you don't have to. Join 5,000+ users and stay up to date on the latest articles your peers are reading.
You know about us, now we want to get to know you!
Let's personalize your content
Let's get even more personalized
We recognize your account from another site in our network, please click 'Send Email' below to continue with verifying your account and setting a password.


Let's personalize your content