This site uses cookies to improve your experience. To help us insure we adhere to various privacy regulations, please select your country/region of residence. If you do not select a country, we will assume you are from the United States. Select your Cookie Settings or view our Privacy Policy and Terms of Use.
Cookie Settings
Cookies and similar technologies are used on this website for proper function of the website, for tracking performance analytics and for marketing purposes. We and some of our third-party providers may use cookie data for various purposes. Please review the cookie settings below and choose your preference.
Used for the proper function of the website
Used for monitoring website traffic and interactions
Cookie Settings
Cookies and similar technologies are used on this website for proper function of the website, for tracking performance analytics and for marketing purposes. We and some of our third-party providers may use cookie data for various purposes. Please review the cookie settings below and choose your preference.
Strictly Necessary: Used for the proper function of the website
Performance/Analytics: Used for monitoring website traffic and interactions
In today's hyperconnected digital landscape, secure internal networks have become a cornerstone of corporate infrastructure. This crucial aspect of operations is often bolstered by robust VPN technologies, such as OpenVPN.
By Alok Tiagi , Hariharan Ananthakrishnan , Ivan Porto Carrero and Keerti Lakshminarayan Netflix has developed a network observability sidecar called Flow Exporter that uses eBPF tracepoints to capture TCP flows at near real time. Without having network visibility, it’s difficult to improve our reliability, security and capacity posture.
As HTTP and browser monitors cover the application level of the ISO /OSI model , successful executions of synthetic tests indicate that availability and performance meet the expected thresholds of your entire technological stack. Are all network devices up and running, and is the network providing reliable and swift access to your systems?
On average, organizations use 10 different tools to monitor applications, infrastructure, and user experiences across these environments. Indeed, around 85% of technology leaders believe their problems are compounded by the number of tools, platforms, dashboards, and applications they rely on to manage multicloud environments.
Therefore, they need an environment that offers scalable computing, storage, and networking. That’s where hyperconverged infrastructure, or HCI, comes in. What is hyperconverged infrastructure? For organizations managing a hybrid cloud infrastructure , HCI has become a go-to strategy. Realizing the benefits of HCI.
Infrastructure monitoring is the process of collecting critical data about your IT environment, including information about availability, performance and resource efficiency. Many organizations respond by adding a proliferation of infrastructure monitoring tools, which in many cases, just adds to the noise. Dynatrace news.
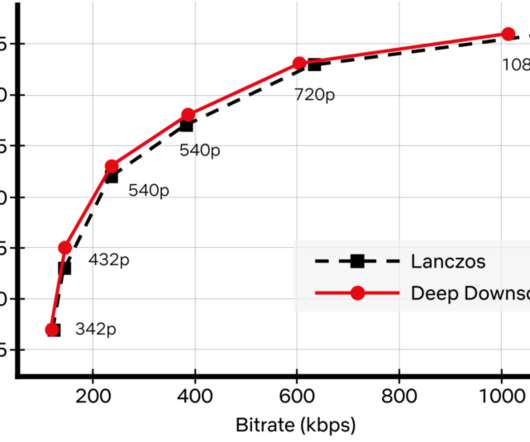
To do so, we continuously push the boundaries of streaming video quality and leverage the best video technologies. Recently, we added another powerful tool to our arsenal: neural networks for video downscaling. How can neural networks fit into Netflix video encoding? Video encoding using a conventional video codec, like AV1.
The success of an organization often depends on the quality of the on-premises or physical IT infrastructure, among other things. Constantly monitoring infrastructure health state and making ongoing optimizations are essential for Ops teams, SREs (site-reliability engineers), and IT admins. Start monitoring in minutes.
This is partly due to the complexity of instrumenting and analyzing emissions across diverse cloud and on-premises infrastructures. Integration with existing systems and processes : Integration with existing IT infrastructure, observability solutions, and workflows often requires significant investment and customization.
Infrastructure and operations teams must maintain infrastructure health for IT environments. With the Infrastructure & Operations app ITOps teams can quickly track down performance issues at their source, in the problematic infrastructure entities, by following items indicated in red.
An hourly rate for Infrastructure Monitoring The Dynatrace Platform Subscription (DPS) offers a flat rate for Infrastructure Monitoring , providing observability for cloud platforms, containers, networks, and data center technologies with no limits on host memory and with AIOps included.
Nearly all government technology leaders (97%) reported the complexity of their technology stack has increased in the past 12 months. The importance of critical infrastructure and services While digital government is necessary, protecting critical infrastructure and services is equally important.
For cloud operations teams, network performance monitoring is central in ensuring application and infrastructure performance. If the network is sluggish, an application may also be slow, frustrating users. Worse, a malicious attacker may gain access to the network, compromising sensitive application data.
Network virtualization has been one of the most significant advancements in the field of networking in recent years. It is a technique that allows the creation of multiple virtual networks, each with its own set of policies, services, and security mechanisms, on top of a single physical networkinfrastructure.
Tons of technologies emerge daily, promising capabilities that help you surpass your performance benchmarks. Knowing how the infrastructure is set up and how clusters operate and communicate are crucial. Building performant services and systems is at the core of every business.
Complexity and data volume for IT infrastructure soars to new heights. The volume of data and events grows in tandem with the rising complexity of IT infrastructure. Monitoring modern IT infrastructure is difficult, sometimes impossible, without advanced network monitoring tools.
Dynatrace integrates application performance monitoring (APM), infrastructure monitoring, and real-user monitoring (RUM) into a single platform, with its Foundation & Discovery mode offering a cost-effective, unified view of the entire infrastructure, including non-critical applications previously monitored using legacy APM tools.
Moving media into the cloud introduces new challenges for production and post ramping up to meet the operational and technological hurdles this poses. Depending on the market, or production budget, cutting-edge technology might not be available or affordable.
But as more organizations adopt cloud-native technologies and distribute workloads among multicloud environments, that goal seems harder to attain. For organizations running their own on-premises infrastructure, these costs can be prohibitive. What is always-on infrastructure?
Network monitoring, at scale, is an age-old problem in IT. In this post, I’ll discuss a brief history of network monitoring tools — including the pain points of legacy technology when it came to monitoring thousands of devices — and share my modern-day solution using Sensu Go and Ansible.
The methodology and algorithms were designed by Dynatrace with guidance from the Sustainable Digital Infrastructure Alliance (SDIA), expanding on formulas from the open source project Cloud Carbon Footprint. Green coding focuses on the software that is running on our digital infrastructure.
More than 90% of enterprises now rely on a hybrid cloud infrastructure to deliver innovative digital services and capture new markets. That’s because cloud platforms offer flexibility and extensibility for an organization’s existing infrastructure. Dynatrace news. With public clouds, multiple organizations share resources.
If you’re doing it right, cloud represents a fundamental change in how you build, deliver and operate your applications and infrastructure. And that includes infrastructure monitoring. This also implies a fundamental change to the role of infrastructure and operations teams. Able to provide answers, not just data.
In the fast-paced realm of Information Technology (IT), organizations grapple with the challenges of maintaining complex and dynamic IT infrastructures. This article explores the role of CMDB in empowering IT infrastructure management, enhancing operational efficiency, and fostering strategic decision-making.
The technology race never stops. Sure, cloud infrastructure requires comprehensive performance visibility, as Dynatrace provides , but the services that leverage cloud infrastructures also require close attention. Extend infrastructure observability to WSO2 API Manager. Dynatrace news. But where does the fault lie?
Dynatrace ActiveGate extensions allow you to integrate Dynatrace monitoring with any remote technology that exposes an interface. Captured metrics include infrastructure measures (CPU, Disk, and Network metrics) as well as details related to Backups, Savepoints, Replication, and more. How to get started.
There are certain situations when an agent based approach isn’t possible, such as with network or storage devices, or a very old OS. In those cases, what should you do if you want to be proactive and ensure that your infrastructure is always up and running? Easy and flexible infrastructure monitoring.
Infrastructure exists to support the backing services that are collectively perceived by users to be your web application. Issues that manifest themselves as performance degradation on a user’s device can often be traced back to underlying infrastructure issues. Dynatrace news. Monitor additional metrics.
From business operations to personal communication, the reliance on software and cloud infrastructure is only increasing. They may stem from software bugs, cyberattacks, surges in demand, issues with backup processes, network problems, or human errors. Outages can disrupt services, cause financial losses, and damage brand reputations.
These include traditional on-premises network devices and servers for infrastructure applications like databases, websites, or email. A local endpoint in a protected network or DMZ is required to capture these messages. The ultimate challenge lies in making data from syslog-supported log sources actionable.
OneAgent gives you all the operational and business performance metrics you need, from the front end to the back end and everything in between—cloud instances, hosts, network health, processes, and services. Next in line are: An NTP (Network Time Protocol) extension that will detect the offset of the host clock. What’s next.
Without having network visibility, it’s not possible to improve our reliability, security and capacity posture. Network Availability: The expected continued growth of our ecosystem makes it difficult to understand our network bottlenecks and potential limits we may be reaching. 43416 5001 52.213.180.42
With this solution, customers will be able to use Dynatrace’s deep observability , advanced AIOps capabilities , and application security to all applications, services, and infrastructure, out-of-the-box. This enables organizations to tame cloud complexity, minimize risk, and reduce manual effort so teams can focus on driving innovation.
If cloud-native technologies and containers are on your radar, you’ve likely encountered Docker and Kubernetes and might be wondering how they relate to each other. In a nutshell, they are complementary and, in part, overlapping technologies to create, manage, and operate containers. Networking. Dynatrace news.
But there are other related components and processes (for example, cloud provider infrastructure) that can cause problems in applications running on Kubernetes. Dynatrace AWS monitoring gives you an overview of the resources that are used in your AWS infrastructure along with their historical usage. Monitoring your i nfrastructure.
Native support for Syslog messages Syslog messages are generated by default in Linux and Unix operating systems, security devices, network devices, and applications such as web servers and databases. Native support for syslog messages extends our infrastructure log support to all Linux/Unix systems and network devices.
Thousands of new technologies are created and integrated with Dynatrace products every day. The IP address of network devices has changed? You usually know precisely what you need regarding monitoring and which technologies and services you want to monitor. Each technology might be monitored differently.
For two decades, Dynatrace NAM—Network Application Monitoring, formerly known as DC RUM—has been successfully monitoring the user experience of our customers’ enterprise applications. SNMP managed the costs of network links well, but not the sources of those costs (i.e., Dynatrace news. Performance has always mattered.
As organizations grapple with mounting cloud complexity, IT teams know they must identify and respond to evolving issues across the entire technology stack—from mainframes to multicloud environments. Endpoints include on-premises servers, Kubernetes infrastructure, cloud-hosted infrastructure and services, and open-source technologies.
But it’s not easy: to pull this off, VFX studios need to build and operate serious technical infrastructure (compute, storage, networking, and software licensing), otherwise known as a “ render farm.” Conductor works on three simple principles: ease of use, collaboration, and optimizing turnaround time.
As more organizations adopt cloud-native technologies, traditional approaches to IT operations have been evolving. We’ll discuss how the responsibilities of ITOps teams changed with the rise of cloud technologies and agile development methodologies. What is ITOps? Why is IT operations important?
IT operations analytics is the process of unifying, storing, and contextually analyzing operational data to understand the health of applications, infrastructure, and environments and streamline everyday operations. Here are the six steps of a typical ITOA process : Define the data infrastructure strategy. Apache Spark.
Containers enable developers to package microservices or applications with the libraries, configuration files, and dependencies needed to run on any infrastructure, regardless of the target system environment. This orchestration includes provisioning, scheduling, networking, ensuring availability, and monitoring container lifecycles.
CaaS automates the processes of hosting, deploying, and managing container technologies. Enterprises can deploy containers faster, as there’s no need to test infrastructure or build clusters. PaaS focuses on code stack infrastructure, while CaaS offers more customization and control over applications and services.
We organize all of the trending information in your field so you don't have to. Join 5,000+ users and stay up to date on the latest articles your peers are reading.
You know about us, now we want to get to know you!
Let's personalize your content
Let's get even more personalized
We recognize your account from another site in our network, please click 'Send Email' below to continue with verifying your account and setting a password.


Let's personalize your content