This site uses cookies to improve your experience. To help us insure we adhere to various privacy regulations, please select your country/region of residence. If you do not select a country, we will assume you are from the United States. Select your Cookie Settings or view our Privacy Policy and Terms of Use.
Cookie Settings
Cookies and similar technologies are used on this website for proper function of the website, for tracking performance analytics and for marketing purposes. We and some of our third-party providers may use cookie data for various purposes. Please review the cookie settings below and choose your preference.
Used for the proper function of the website
Used for monitoring website traffic and interactions
Cookie Settings
Cookies and similar technologies are used on this website for proper function of the website, for tracking performance analytics and for marketing purposes. We and some of our third-party providers may use cookie data for various purposes. Please review the cookie settings below and choose your preference.
Strictly Necessary: Used for the proper function of the website
Performance/Analytics: Used for monitoring website traffic and interactions
One of the promises of container orchestration platforms is to make i t easier for the developers to accelerate the deployment of their app lication s without having to worry about scalability and infrastructure dependencies. A failure on one of the cluster components can bring down all the applications running on it.
As of September 2020, we run 51 clusters on 1100 EC2 instances distributed across six AWS Regions ensuring that all our users can leverage the Dynatrace Software Intelligence Platform to monitor their hybrid-multi cloud environments. Modern hybrid-multicloud monitoring needs more than just metrics.
Anyone moving to the cloud knows that it isn’t just a change from running servers in your data center to running them in someone else’s data center. If you’re doing it right, cloud represents a fundamental change in how you build, deliver and operate your applications and infrastructure. And that includes infrastructuremonitoring.
Event-driven automation enables systems to react instantly to specific triggers or events, enhancing infrastructure resilience and efficiency. A simple and effective method for implementing event-driven automation is through webhooks, which can initiate specific actions in response to events.
Dynatrace OneAgent is great for monitoring the full stack. In those cases, what should you do if you want to be proactive and ensure that your infrastructure is always up and running? While this will give you a lot of information about the health of these components, sometimes a simple synthetic monitor is sufficient.
Current synthetic capabilities Dynatrace Synthetic Monitoring is a powerful tool that provides insight into the health of your applications around the clock and as they’re perceived by your end users worldwide. You want to be able to answer questions like these: What is responsible for application slowdown?
Don’t worry, when it comes to SAP monitoring, Dynatrace has you covered. Dynatrace ActiveGate extensions allow you to integrate Dynatrace monitoring with any remote technology that exposes an interface. Today we’re proud to announce that we’ve extended our SAP monitoring capabilities to support SAP HANA databases.
IT infrastructure is the heart of your digital business and connects every area – physical and virtual servers, storage, databases, networks, cloud services. We’ve seen the IT infrastructure landscape evolve rapidly over the past few years. What is infrastructuremonitoring? . Dynatrace news.
With Dashboards , you can monitor business performance, user interactions, security vulnerabilities, IT infrastructure health, and so much more, all in real time. Follow along to create this host monitoring dashboard We will create a basic Host Monitoring dashboard in just a few minutes. Create a new dashboard.
In fact, according to a Dynatrace global survey of 1,300 CIOs , 99% of enterprises utilize a multicloud environment and seven cloud monitoring solutions on average. What is cloud monitoring? Cloud monitoring is a set of solutions and practices used to observe, measure, analyze, and manage the health of cloud-based IT infrastructure.
That’s where hyperconverged infrastructure, or HCI, comes in. What is hyperconverged infrastructure? Hyperconverged infrastructure (HCI) is an IT architecture that combines servers, storage, and networking functions into a unified, software-centric platform to streamline resource management.
Applications and services are often slowed down by under-performing DNS communications or misconfigured DNS servers, which can result in frustrated customers uninstalling your application. While our competitors only provide generic traffic monitoring without artificial intelligence, Dynatrace automatically analyzes DNS-related anomalies.
.” While this methodology extends to every layer of the IT stack, infrastructure as code (IAC) is the most prominent example. Here, we’ll tackle the basics, benefits, and best practices of IAC, as well as choosing infrastructure-as-code tools for your organization. What is infrastructure as code? Consistency.
Take your monitoring, data exploration, and storytelling to the next level with outstanding data visualization All your applications and underlying infrastructure produce vast volumes of data that you need to monitor or analyze for insights. Have a look at them on our Dynatrace Playground.
Use Cases and Requirements At Netflix, our counting use cases include tracking millions of user interactions, monitoring how often specific features or experiences are shown to users, and counting multiple facets of data during A/B test experiments , among others. Now, let’s see how these events are aggregated for a given counter.
Sure, cloud infrastructure requires comprehensive performance visibility, as Dynatrace provides , but the services that leverage cloud infrastructures also require close attention. Extend infrastructure observability to WSO2 API Manager. Save hours of bug hunting with out-of-the-box WSO2 API Manager monitoring.
Digital experience monitoring (DEM) is crucial for organizations to meet this demand and succeed in today’s competitive digital economy. DEM solutions monitor and analyze the quality of digital experiences for users across digital channels. The time taken to complete the page load.
IBM i, formerly known as iSeries, is an operating system developed by IBM for its line of IBM i Power Systems servers. It’s all monitored remotely ! Default dashboard for IBM I monitoring The default dashboard provides an overview of all monitored systems and how many different entities are created by IBM i components.
With the world’s increased reliance on digital services and the organizational pressure on IT teams to innovate faster, the need for DevOps monitoring tools has grown exponentially. But when and how does DevOps monitoring fit into the process? And how do DevOps monitoring tools help teams achieve DevOps efficiency?
Infrastructure exists to support the backing services that are collectively perceived by users to be your web application. Issues that manifest themselves as performance degradation on a user’s device can often be traced back to underlying infrastructure issues. Monitor additional metrics. Dynatrace news.
Log monitoring, log analysis, and log analytics are more important than ever as organizations adopt more cloud-native technologies, containers, and microservices-based architectures. A log is a detailed, timestamped record of an event generated by an operating system, computing environment, application, server, or network device.
In today's rapidly evolving digital landscape, businesses increasingly rely on cloud computing and infrastructure to support their operations. As organizations migrate their workloads to the cloud, robust monitoring and management tools are paramount to ensure optimal performance, security, and efficiency.
A primary challenge in managing these hybrid Kubernetes clusters is the fragmented monitoring caused by using siloed tools with varying support for the different operating systems. This inconsistency leads to gaps in monitoring and alerting, making it difficult to maintain a unified view of the cluster’s health.
Monitoring with ?the Readers who share our privacy concerns, please note, all the data we monitor is publicly available. . The insights in this b log rely heavily on data captured by Dynatrace’s proactive synthetic monitoring capabilities. We ’ve also been monitoring U. the Dynatrace®?
Having released this functionality in a Preview Release back in May 2019, we’re now happy to announce the General Availability of our SAP ABAP monitoring extension. This extends Dynatrace visibility into SAP ABAP performance from the infrastructure and ABAP application platform perspective. What is ABAP platform monitoring?
We’re proud to announce the Early Access Program (EAP) for monitoring of SAP ABAP performance from the infrastructure and ABAP application platform perspective. Why SAP ABAP platform monitoring in Dynatrace? As of today, the SAP ABAP application server remains the central component of the SAP ERP solution.
Digital experience monitoring (DEM) allows an organization to optimize customer experiences by taking into account the context surrounding digital experience metrics. What is digital experience monitoring? Primary digital experience monitoring tools.
Prometheus is an open-source monitoring and alerting toolkit for services and applications that run in containers. Prometheus components include client libraries for application code instrumentation, special-purpose exporters for popular services, and the optional Prometheus server for orchestrating service discovery and data storage.
RabbitMQ can be deployed in distributed environments and includes monitoring tools through a built-in dashboard and CLI. Kafka clusters can be deployed in Kubernetes using Helm charts to simplify scaling and management across multiple servers. These tools help ensure proactive monitoring and quick issue resolution.
This has led to the recent release of our new Lambda monitoring extension supporting Node.js, Java, and Python. This extension was built from scratch to take into account all we’ve learned and the special requirements for monitoring ephemeral, auto-scaling, micro VMs like AWS Lambda. A look under the hood of AWS Lambda.
Gone are the days when developers handled app development, server logs, infrastructures, and other resources single-handedly. They offer scalable, flexible, and cost-effective solutions that eliminate the need to manage servers. Serverless architectures offload routine tasks from developers and let them focus on app building.
Having released this functionality in a Preview Release back in October 2019, we’re now happy to announce the General Availability of our SAP ABAP real user monitoring. We listened to our customers, and with our recent update, we’ve added real user visibility to our SAP ABAP monitoring extension. Dynatrace news. What you get.
Cloud integration and application performance monitoring at the federal level is in full force. Managing the mission with cloud monitoring. The EMCA recently implemented a new monitoring approval process, which breaks down details such as how a system functions, how information is being shared, and the overall software capabilities.
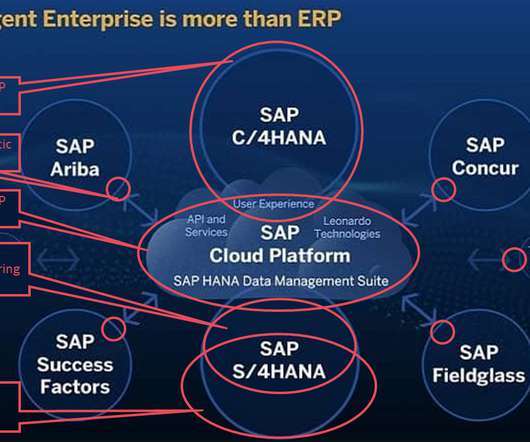
This means that you should ask the following: Does your monitoring solution work with SAP both on-premise and within cloud infrastructure ? Cover all your monitoring needs across your entire SAP product portfolio with Dynatrace. Monitor, analyze, and boost customer experience on SAP C/4HANA and SAP Cloud Platform.
You need a smart approach to mobile app monitoring—Dynatrace monitoring for mobile apps provides comprehensive insights from mobile to back-end services, enabling you to provide great user experience for your apps and ultimately grow your business. Monitor your AppleTV device users with the new tvOS support. Dynatrace news.
Complex syslog ecosystems can be challenging Monitoring devices and applications that provide output via the syslog protocol is a must-have for many organizations. These include traditional on-premises network devices and servers for infrastructure applications like databases, websites, or email.
Many of our customers—the world’s largest enterprises—have embraced the Dynatrace SaaS approach to monitoring, which provides critical business insights powered by AI and automation for globally-distributed, heterogeneous IT landscapes. New self-monitoring environment provides out-of-the-box insights and custom alerting.
A single instance of OneAgent can handle the monitoring of many types of entities , including servers, applications, services, databases, and more. But what if a particular metric is crucial for your monitoring needs and it isn’t there? Looking for ways to solve some of your infrastructure-related problems?
A critical security threat for cloud-native architectures SSRF is a web security vulnerability that allows an attacker to make a server-side application send requests to unintended locations. This can include internal services within an organizations infrastructure or external systems.
Having released this functionality in an Preview Release back in September 2019, we’re now happy to announce the General Availability of our Citrix monitoring extension. Citrix is a sophisticated, efficient, and highly scalable application delivery platform that is itself comprised of anywhere from hundreds to thousands of servers.
Observability and monitoring as a source of truth. To provide actionable answers monitoring systems store, baseline, and analyze telemetry data. But there are other related components and processes (for example, cloud provider infrastructure) that can cause problems in applications running on Kubernetes.
The next phase of my amazement involves deep introspection into a monitoring and observability solution called Dynatrace. The market offers plenty of monitoring solutions that can link a specific monitored event with a specific scripted action. Dynatrace’s deterministic AI evaluates multiple conditions of an application server.
The success of an organization often depends on the quality of the on-premises or physical IT infrastructure, among other things. Constantly monitoringinfrastructure health state and making ongoing optimizations are essential for Ops teams, SREs (site-reliability engineers), and IT admins. Start monitoring in minutes.
With this solution, customers will be able to use Dynatrace’s deep observability , advanced AIOps capabilities , and application security to all applications, services, and infrastructure, out-of-the-box. You must procure hardware, install the OS on the server, install the application, and configure it.
We organize all of the trending information in your field so you don't have to. Join 5,000+ users and stay up to date on the latest articles your peers are reading.
You know about us, now we want to get to know you!
Let's personalize your content
Let's get even more personalized
We recognize your account from another site in our network, please click 'Send Email' below to continue with verifying your account and setting a password.


Let's personalize your content