This site uses cookies to improve your experience. To help us insure we adhere to various privacy regulations, please select your country/region of residence. If you do not select a country, we will assume you are from the United States. Select your Cookie Settings or view our Privacy Policy and Terms of Use.
Cookie Settings
Cookies and similar technologies are used on this website for proper function of the website, for tracking performance analytics and for marketing purposes. We and some of our third-party providers may use cookie data for various purposes. Please review the cookie settings below and choose your preference.
Used for the proper function of the website
Used for monitoring website traffic and interactions
Cookie Settings
Cookies and similar technologies are used on this website for proper function of the website, for tracking performance analytics and for marketing purposes. We and some of our third-party providers may use cookie data for various purposes. Please review the cookie settings below and choose your preference.
Strictly Necessary: Used for the proper function of the website
Performance/Analytics: Used for monitoring website traffic and interactions
By: Rajiv Shringi , Oleksii Tkachuk , Kartik Sathyanarayanan Introduction In our previous blog post, we introduced Netflix’s TimeSeries Abstraction , a distributed service designed to store and query large volumes of temporal event data with low millisecond latencies. Today, we’re excited to present the Distributed Counter Abstraction.
Message brokers handle validation, routing, storage, and delivery, ensuring efficient and reliable communication. Message Broker vs. Distributed Event Streaming Platform RabbitMQ functions as a message broker, managing message confirmation, routing, storage, and delivery within a queue. What is RabbitMQ?
Now let’s look at how we designed the tracing infrastructure that powers Edgar. If we had an ID for each streaming session then distributed tracing could easily reconstruct session failure by providing service topology, retry and error tags, and latency measurements for all service calls.
At this scale, we can gain a significant amount of performance and cost benefits by optimizing the storage layout (records, objects, partitions) as the data lands into our warehouse. We built AutoOptimize to efficiently and transparently optimize the data and metadata storage layout while maximizing their cost and performance benefits.
Vidhya Arvind , Rajasekhar Ummadisetty , Joey Lynch , Vinay Chella Introduction At Netflix our ability to deliver seamless, high-quality, streaming experiences to millions of users hinges on robust, global backend infrastructure. Data Model At its core, the KV abstraction is built around a two-level map architecture.
The Challenge of Title Launch Observability As engineers, were wired to track system metrics like error rates, latencies, and CPU utilizationbut what about metrics that matter to a titlessuccess? This approach provides a few advantages: Low burden on existing systems: Log processing imposes minimal changes to existing infrastructure.
As an open source database, it’s a highly popular choice for enterprise applications looking to modernize their infrastructure and reduce their total cost of ownership, along with startup and developer applications looking for a powerful, flexible and cost-effective database to work with. Compare Latency. At a glance – TLDR.
Rajiv Shringi Vinay Chella Kaidan Fullerton Oleksii Tkachuk Joey Lynch Introduction As Netflix continues to expand and diversify into various sectors like Video on Demand and Gaming , the ability to ingest and store vast amounts of temporal data — often reaching petabytes — with millisecond access latency has become increasingly vital.
Therefore, it requires multidimensional and multidisciplinary monitoring: Infrastructure health —automatically monitor the compute, storage, and network resources available to the Citrix system to ensure a stable platform. OneAgent: Citrix infrastructure performance. OneAgent: SAP infrastructure performance. Citrix VDA.
FUN FACT : In this talk , Rodrigo Schmidt, director of engineering at Instagram talks about the different challenges they have faced in scaling the data infrastructure at Instagram. After that, the post gets added to the feed of all the followers in the columnar data storage. System Components. Fetching User Feed. Optimization.
Compare Latency. On average, ScaleGrid achieves almost 30% lower latency over DigitalOcean for the same deployment configurations. ScaleGrid provides 30% more storage on average vs. DigitalOcean for MySQL at the same affordable price. Read-Intensive Latency Benchmark. Balanced Workload Latency Benchmark.
Caching is the process of storing frequently accessed data or resources in a temporary storage location, such as memory or disk, to improve retrieval speed and reduce the need for repetitive processing.
Secondly, determining the correct allocation of resources (CPU, memory, storage) to each virtual machine to ensure optimal performance without over-provisioning can be difficult. Firstly, managing virtual networks can be complex as networking in a virtual environment differs significantly from traditional networking.
By integrating Nutanix metrics into Dynatrace, you can gain valuable insights into the performance and health of your Nutanix infrastructure. Performance monitoring Dynatrace can collect performance metrics from Nutanix clusters, including latency, IOPS (Input/Output Operations Per Second), and network throughput.
Data warehouses offer a single storage repository for structured data and provide a source of truth for organizations. Unlike data warehouses, however, data is not transformed before landing in storage. A data lakehouse provides a cost-effective storage layer for both structured and unstructured data. Data management.
While clustering across wide-area networks (WANs) is discouraged due to latency issues, leased links can mitigate some connectivity challenges. Keeping queues short minimizes latency and enhances the overall efficiency of message delivery in RabbitMQ. Keeping queues short maintains a responsive and efficient RabbitMQ setup.
A distributed storage system is foundational in today’s data-driven landscape, ensuring data spread over multiple servers is reliable, accessible, and manageable. Understanding distributed storage is imperative as data volumes and the need for robust storage solutions rise.
This includes how quickly the application loads, how much load it is putting on the device, how much storage is being used, and how frequently it crashes. By monitoring metrics such as error rates, response times, and network latency, developers can identify trends and potential issues, so they don’t become critical. Issue remediation.
The network latency between cluster nodes should be around 10 ms or less. For Premium HA, this has been extended from 10 ms latency (in the same network region) to around 100 ms network latency due to asynchronous data replication between regions. In the image below, three downed nodes make an entire cluster unavailable.
AI requires more compute and storage. Training AI data is resource-intensive and costly, again, because of increased computational and storage requirements. As a result, AI observability supports cloud FinOps efforts by identifying how AI adoption spikes costs because of increased usage of storage and compute resources.
These releases often assumed ideal conditions such as zero latency, infinite bandwidth, and no network loss, as highlighted in Peter Deutsch’s eight fallacies of distributed systems. With Dynatrace, teams can seamlessly monitor the entire system, including network switches, database storage, and third-party dependencies.
Optimize the IT infrastructure supporting risk management processes and controls for maximum performance and resilience. The IT infrastructure, services, and applications that enable processes for risk management must perform optimally. Once teams solidify infrastructure and application performance, security is the subsequent priority.
Note : you might hear the term latency used instead of response time. Both latency and response time are critical to ensure reliability. Latency typically refers to the time it takes for a single request to travel from its source to its destination. Latency primarily focuses on the time spent in transit.
The data warehouse is not designed to serve point requests from microservices with low latency. Therefore, we must efficiently move data from the data warehouse to a global, low-latency and highly-reliable key-value store. Bulldozer abstracts the underlying infrastructure on how the data moves.
Expanding the Cloud - The AWS Storage Gateway. Today Amazon Web Services has launched the AWS Storage Gateway, making the power of secure and reliable cloud storage accessible from customersâ?? With the launch of the AWS Storage Gateway our customers can now integrate their on-premises IT environment with AWSâ??s
This is particularly important as we build out new functionality that relies on Pushy; a strong, stable infrastructure foundation allows our partners to continue to build on top of Pushy with confidence. KeyValue is an abstraction over the storage engine itself, which allows us to choose the best storage engine that meets our SLO needs.
Without distributed tracing, pinpointing the cause of increased latency could take hours or even days. There is no need to think about schema and indexes, re-hydration, or hot/cold storage. Interact with data intuitively and easily and benefit from immediate, AI-supported insights.
ITOps is an IT discipline involving actions and decisions made by the operations team responsible for an organization’s IT infrastructure. Besides the traditional system hardware, storage, routers, and software, ITOps also includes virtual components of the network and cloud infrastructure. What does IT operations do?
As a software intelligence platform, Dynatrace is woven into the fabric of your business systems, actively managing and providing self-healing capabilities for all aspects of your applications and vital infrastructure. Metrics are provided for general host info like CPU usage and memory consumption, OneAgent traffic, and network latency.
Therefore, it requires multidimensional and multidisciplinary monitoring: Infrastructure health —automatically monitor the compute, storage, and network resources available to the Citrix system to ensure a stable platform. OneAgent: Citrix infrastructure performance. OneAgent: SAP infrastructure performance. Citrix VDA.
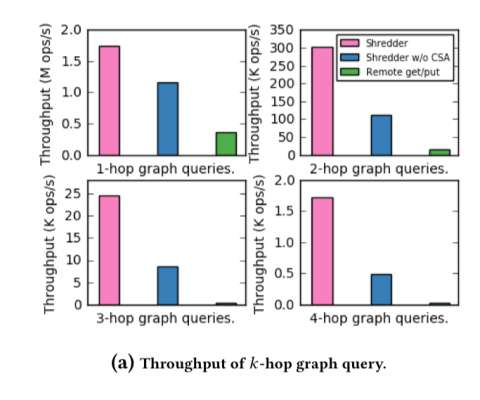
Narrowing the gap between serverless and its state with storage functions , Zhang et al., Shredder is " a low-latency multi-tenant cloud store that allows small units of computation to be performed directly within storage nodes. " SoCC’19. "Narrowing Shredder’s implementation is built on top of Seastar.
This proximity reduces latency and enables real-time decision-making. Edge computing will process and filter this data before sending only the most relevant insights to the cloud, making large-scale IIoT deployments more feasible and reducing cloud storage and bandwidth costs.
For instance, in a Kubernetes environment, if an application fails, logs in context not only highlight the error alongside corresponding log entries but also provide correlated logs from surrounding services and infrastructure components. There is no need to think about schema and indexes, re-hydration, or hot/cold storage.
Netflix shares how Amazon EC2 Auto Scaling allows its infrastructure to automatically adapt to changing traffic patterns in order to keep its audience entertained and its costs on target. Netflix runs dozens of stateful services on AWS under strict sub-millisecond tail-latency requirements, which brings unique challenges. Wednesday?—?December
We’re proud to introduce AWS Outposts support, allowing you to manage cloud infrastructure on-premises while maintaining full AWS integration. Additionally, we’ve added the Philadelphia AWS Local Zone , helping to reduce latency for customers operating in the eastern U.S.
The Site Reliability Guardian helps automate release validation based on SLOs and important signals that define the expected behavior of your applications in terms of availability, performance errors, throughput, latency, etc. A study by Amazon found that increasing page load time by just 100 milliseconds costs 1% in sales.
Metrics are measures of critical system values, such as CPU utilization or average write latency to persistent storage. As a result, teams can gain full visibility into their applications and multicloud infrastructure. A database could start executing a storage management process that consumes database server resources.
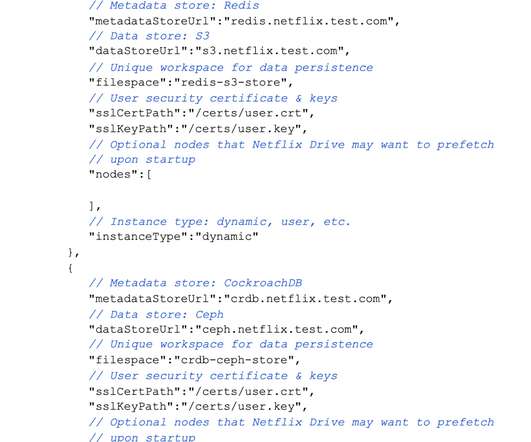
Netflix Drive relies on a data store that will be the persistent storage layer for assets, and a metadata store which will provide a relevant mapping from the file system hierarchy to the data store entities. Finally, once the encoded copy is prepared, this copy can be persisted by Netflix Drive to a persistent storage tier in the cloud.
Amazon DynamoDB offers low, predictable latencies at any scale. In response, we began to develop a collection of storage and database technologies to address the demanding scalability and reliability requirements of the Amazon.com ecommerce platform. s read latency, particularly as dataset sizes grow. The growth of Amazonâ??s
Gartner estimates that by 2025, 70% of digital business initiatives will require infrastructure and operations (I&O) leaders to include digital experience metrics in their business reporting. With DEM solutions, organizations can operate over on-premise network infrastructure or private or public cloud SaaS or IaaS offerings.
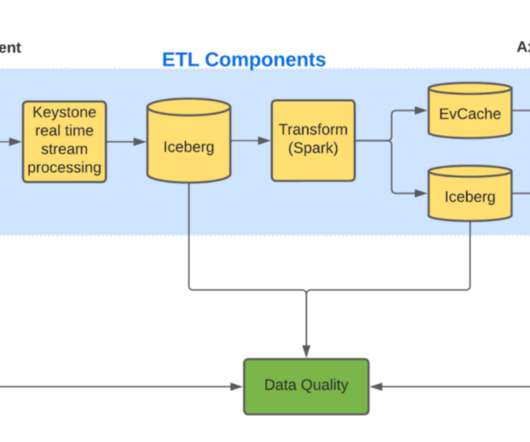
fact logging client, ETL, query client, and data quality infrastructure. The first version of our logger library optimized for storage by deduplicating facts and optimized for network i/o using different compression methods for each fact. Design evolution Axion fact store has four components?—?fact
million” – Gartner Data observability is a practice that helps organizations understand the full lifecycle of data, from ingestion to storage and usage, to ensure data health and reliability. This requires monitoring of the upstream infrastructure, applications, or platform supporting those data streams.
Note : you might hear the term latency used instead of response time. Both latency and response time are critical to ensure reliability. Latency typically refers to the time it takes for a single request to travel from its source to its destination. Latency primarily focuses on the time spent in transit.
Identifying key Redis metrics such as latency, CPU usage, and memory metrics is crucial for effective Redis monitoring. To monitor Redis instances effectively, collect Redis metrics focusing on cache hit ratio, memory allocated, and latency threshold.
We organize all of the trending information in your field so you don't have to. Join 5,000+ users and stay up to date on the latest articles your peers are reading.
You know about us, now we want to get to know you!
Let's personalize your content
Let's get even more personalized
We recognize your account from another site in our network, please click 'Send Email' below to continue with verifying your account and setting a password.


Let's personalize your content