This site uses cookies to improve your experience. To help us insure we adhere to various privacy regulations, please select your country/region of residence. If you do not select a country, we will assume you are from the United States. Select your Cookie Settings or view our Privacy Policy and Terms of Use.
Cookie Settings
Cookies and similar technologies are used on this website for proper function of the website, for tracking performance analytics and for marketing purposes. We and some of our third-party providers may use cookie data for various purposes. Please review the cookie settings below and choose your preference.
Used for the proper function of the website
Used for monitoring website traffic and interactions
Cookie Settings
Cookies and similar technologies are used on this website for proper function of the website, for tracking performance analytics and for marketing purposes. We and some of our third-party providers may use cookie data for various purposes. Please review the cookie settings below and choose your preference.
Strictly Necessary: Used for the proper function of the website
Performance/Analytics: Used for monitoring website traffic and interactions
Infrastructure exists to support the backing services that are collectively perceived by users to be your web application. Issues that manifest themselves as performance degradation on a user’s device can often be traced back to underlying infrastructure issues. Monitor additional metrics. Dynatrace news.
While many companies now enlist public cloud services such as Amazon Web Services, Google Public Cloud, or Microsoft Azure to achieve their business goals, a majority also use hybrid cloud infrastructure to accommodate traditional applications that can’t be easily migrated to public clouds. How to modernize for hybrid cloud.
The release candidate of OpenTelemetry metrics was announced earlier this year at Kubecon in Valencia, Spain. Since then, organizations have embraced OTLP as an all-in-one protocol for observability signals, including metrics, traces, and logs, which will also gain Dynatrace support in early 2023. What’s ahead in 2023.
Today, Dynatrace is happy to announce OneAgent support for discovering and automatically capturing OpenTelemetry trace data for Java. PurePath integrates OpenTelemetry Java data for enterprise-grade collection and contextual analytics. OpenTelemetry Java API version 1.0.0 Use-case example: WorldAtlas sample application.
Now let’s look at how we designed the tracing infrastructure that powers Edgar. This insight led us to build Edgar: a distributed tracing infrastructure and user experience. Our tactical approach was to use Netflix-specific libraries for collecting traces from Java-based streaming services until open source tracer libraries matured.
Findings provide insights into Kubernetes practitioners’ infrastructure preferences and how they use advanced Kubernetes platform technologies. Kubernetes infrastructure models differ between cloud and on-premises. Java, Go, and Node.js Kubernetes infrastructure models differ between cloud and on-premises.
Loosely defined, observability is the ability to understand what’s happening inside a system from the knowledge of the external data it produces, which are usually logs, metrics, and traces. Capturing data is critical to understanding how your applications and infrastructure are performing at any given time.
By analyzing benchmark results, organizations can determine which system aligns best with their infrastructure needswhether its high-speed event processing or reliable message queuing for microservices. Apache Kafka primarily uses JAAS (Java Authentication and Authorization Service) for authentication.
That is, relying on metrics, logs, and traces to understand what software is doing and where it’s running into snags. In addition to tracing, observability also defines two other key concepts, metrics and logs. When software runs in a monolithic stack on on-site servers, observability is manageable enough.
By open-sourcing the project, we hope to contribute to the Java and GraphQL communities and learn from and collaborate with everyone who will be using the framework to make it even better in the future. The transition to the new federated architecture meant that many of our backend teams needed to adopt GraphQL in our Java ecosystem.
In fact, 76% of technology leaders say the dynamic nature of Kubernetes makes it more difficult to maintain visibility of their infrastructure compared with traditional technology stacks. “For example, if most teams run Java, it might not make sense trying to support an outlier. “And these layers tend to be similar.
Cloud migration enables IT teams to enlist public cloud infrastructure so an organization can innovate without getting bogged down in managing all aspects of IT infrastructure as it scales. They need ways to monitor infrastructure, even if it’s no longer on premises. Right-sizing infrastructure. Repurchase.
Log auditing—and its investigative partner, log forensics—are becoming essential practices for securing cloud-native applications and infrastructure. As organizations adopt more cloud-native technologies, observability data—telemetry from applications and infrastructure, including logs, metrics, and traces—and security data are converging.
For IT infrastructure managers and site reliability engineers, or SREs , logs provide a treasure trove of data. These traditional approaches to log monitoring and log analytics thwart IT teams’ goal to address infrastructure performance problems, security threats, and user experience issues. where an error occurred at the code level.
Cloud-native observability for Google’s fully managed GKE Autopilot clusters demands new methods of gathering metrics, traces, and logs for workloads, pods, and containers to enable better accessibility for operations teams. These CSI pods provide a unique way of solving a handful of infrastructure problems. Agent logs security.
Monitoring SAP products can present challenges Monitoring SAP systems can be challenging due to the inherent complexity of using different technologies—such as ABAP, Java, and cloud offerings—and the sheer amount of generated data. SAP HANA server infrastructure monitored with OneAgent.
Citrix is critical infrastructure For businesses operating in industries with strict regulations, such as healthcare, banking, or government, Citrix virtual apps and virtual desktops are essential for simplified infrastructure management, secure application delivery, and compliance requirements.
The Dynatrace ® unified observability and security platform addresses the needs of enterprise-edge scenarios by managing the health and performance of containerized applications and multi-cloud infrastructures with metrics, traces, and logs in one place.
A single API team maintained both the Java implementation of the Falcor framework and the API Server. So, we relied on higher-level metrics-based testing: AB Testing and Sticky Canaries. To determine customer impact, we could compare various metrics such as error rates, latencies, and time to render.
At Dynatrace, where we provide a software intelligence platform for hybrid environments (from infrastructure to cloud) we see a growing need to measure how mainframe architecture and the services running on it contribute to the overall performance and availability of applications. Network metrics are also collected for detected processes.
This has led to the recent release of our new Lambda monitoring extension supporting Node.js, Java, and Python. Distributing accounts across the infrastructure is an architectural decision, as a given account often has similar usage patterns, languages, and sizes for their Lambda functions. file uploaded to AWS Lambda.
Observability Observability is the ability to determine a system’s health by analyzing the data it generates, such as logs, metrics, and traces. There are three main types of telemetry data: Metrics. Metrics are typically aggregated and stored in time series databases for monitoring and alerting purposes.
With the release of Dynatrace 1.194, we’ve added CPU related infrastructuremetrics for LPARs (host metrics) and regions (process metrics) and expanded our multidimensional analysis to IBM Z systems, including CICS, IMS, and the CICS transaction gateway. . This metric helps you to understand your current workload.
The first step is determining whether the problem originates from the application or the underlying infrastructure. Learn how Linux kernel instrumentation can improve your infrastructure observability with deeper insights and enhanced monitoring. One issue that often complicates this process is the "noisy neighbor" problem.
focused on technology coverage, building on the flexibility of JMX for Java and Python-based coded extensions for everything else. are automatically distributed to a group of ActiveGates, balancing the load automatically and switching workloads in case of infrastructure failure, to assure continued monitoring execution.
Symptoms : No data is provided for affected metrics on dashboards, alerts, and custom device pages populated by the affected extension metrics. Infrastructure Monitoring. Settings > Anomaly detection > Infrastructure. Infrastructure Monitoring. Infrastructure Monitoring. Resolved issues.
Apart from its best-in-class observability capabilities like distributed traces, metrics, and logs, Dynatrace OneAgent additionally provides automatic deep code-level insights for Java,NET, Node.js, PHP, and Golang, without the need to change any application code or configuration. Fully automated code-level visibility.
Red Hat and Dynatrace integration overview The strategic partnership and integration between Red Hat and Dynatrace are game changers that solve each mentioned pain point: Easily ingest (and gain precise insights into) your logs, metrics, traces, and business data. In-context topology identification.
With other products, we had to make guesses about the impacted services based solely on metrics”. By observing these metrics, you can easily catch unbalanced message processing that could result in severe problems such as queue overflows when producer services send significantly more messages to the queue than consumer services can process.
Dynatrace monitors your full stack and offers you thousands of metrics with almost zero configuration. This article we help distinguish between process metrics, external metrics and PurePaths (traces). OneAgent & application metrics. OneAgent & cloud metrics. Dynatrace news.
Other distributions like Debian and Fedora are available as well, in addition to other software like VMware, NGINX, Docker, and, of course, Java. This is especially the case with microservices and applications created around multiple tiers, where cheaper hardware alternatives play a significant role in the infrastructure footprint.
Most monitoring tools for migrations, development, and operations focus on collecting and aggregating the three pillars of observability— metrics, traces, and logs. With Dynatrace’s full-stack monitoring capabilities, organizations can assess how underlying infrastructure resources affect the application’s performance.
service with a composable JavaScript API that made downstream microservice calls, replacing the old Java API. Java…Script? As Android developers, we’ve come to rely on the safety of a strongly typed language like Kotlin, maybe with a side of Java. We will talk more about how we used these metrics in the sections to follow.
For example: Infrastructure services might provide data about request timings that can give you a precise overview of system health, but the data is logged in a custom format. For example, Dynatrace recently introduced the extraction of log-based metrics for JSON logs. and product.quantity extracted automatically. time + batchjob2.time)).
AWS Fargate is the exception to this rule: with the AWS serverless compute engine, paired with Dynatrace intelligent observability for Kubernetes, customers can forgo the complex burden of managing and monitoring their own server infrastructure. Flexible monitoring of pods with OneAgent on EKS. and Golang containers.
For full-stack monitoring, you need 360-degree visibility from each customer’s initial interaction with your applications, through the entire request call sequence, down to containers, infrastructure, and cloud. Seamlessly integrate custom metrics and create new value on top of Dynatrace.
For today’s highly dynamic and exceedingly complex production environments, performance problems that are evident at the service level (for example, slow response times or failed requests) are often the result of underlying (cloud) infrastructure issues. Unlock extended end-to-end traceability for OpenTelemetry-instrumented Go applications.
At Dynatrace, where we provide a software intelligence platform for hybrid environments (from infrastructure to cloud) we see a growing need to measure how mainframe architecture and the services running on it contribute to the overall performance and availability of applications. Network metrics are also collected for detected processes.
The headlining feature of GCP is Google’s Compute Engine , a service for creating and running virtual machines in the Google infrastructure—a direct analog to AWS’ EC2 instances and Azure’s VMs. GCF also enables teams to run custom-written code to connect multiple services in Node, Python, Go, Java,NET, Ruby, and PHP.
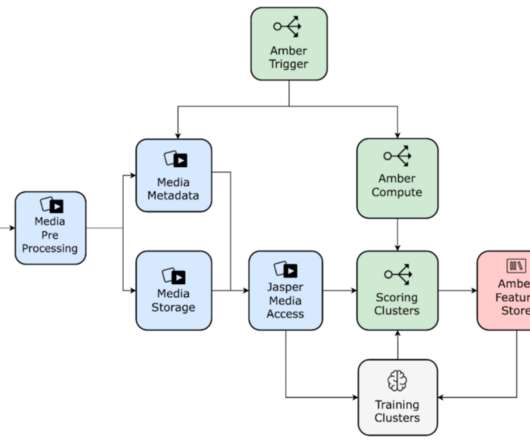
Our goal in building a media-focused ML infrastructure is to reduce the time from ideation to productization for our media ML practitioners. Amber is a suite of multiple infrastructure components that offers triggering capabilities to initiate the computation of algorithms with recursive dependency resolution.
When an incident occurs, developers need to know what data to look at, where the incident occurred, and other relevant metrics. They also care about infrastructure: SREs require system visibility and incident management. In Grabner’s example, he understood that there was an increased Java error rate on the front end of the application.
They can develop software applications rapidly and gain access to extensible cloud resources without having to sink costs into IT plumbing or managing this infrastructure themselves. Spring4Shell: Detect and mitigate new zero-day vulnerabilities in the Java Spring Framework – blog. DevSecOps: Security by design.
Our Journey so Far Over the past year, we’ve implemented the core infrastructure pieces necessary for a federated GraphQL architecture as described in our previous post: Studio Edge Architecture The first Domain Graph Service (DGS) on the platform was the former GraphQL monolith that we discussed in our first post (Studio API).
The OpenTelemetry project was created to address the growing need for artificial intelligence-enabled IT operations — or AIOps — as organizations broaden their technology horizons beyond on-premises infrastructure and into multiple clouds. The other option is semi-automatic instrumentation. ” Extended visibility.
We organize all of the trending information in your field so you don't have to. Join 5,000+ users and stay up to date on the latest articles your peers are reading.
You know about us, now we want to get to know you!
Let's personalize your content
Let's get even more personalized
We recognize your account from another site in our network, please click 'Send Email' below to continue with verifying your account and setting a password.


Let's personalize your content