This site uses cookies to improve your experience. To help us insure we adhere to various privacy regulations, please select your country/region of residence. If you do not select a country, we will assume you are from the United States. Select your Cookie Settings or view our Privacy Policy and Terms of Use.
Cookie Settings
Cookies and similar technologies are used on this website for proper function of the website, for tracking performance analytics and for marketing purposes. We and some of our third-party providers may use cookie data for various purposes. Please review the cookie settings below and choose your preference.
Used for the proper function of the website
Used for monitoring website traffic and interactions
Cookie Settings
Cookies and similar technologies are used on this website for proper function of the website, for tracking performance analytics and for marketing purposes. We and some of our third-party providers may use cookie data for various purposes. Please review the cookie settings below and choose your preference.
Strictly Necessary: Used for the proper function of the website
Performance/Analytics: Used for monitoring website traffic and interactions
Log monitoring, log analysis, and log analytics are more important than ever as organizations adopt more cloud-native technologies, containers, and microservices-based architectures. A log is a detailed, timestamped record of an event generated by an operatingsystem, computing environment, application, server, or network device.
Hyper-V plays a vital role in ensuring the reliable operations of data centers that are based on Microsoft platforms. Microsoft Hyper-V is a virtualization platform that manages virtual machines (VMs) on Windows-based systems. Start monitoring Hyper-V Navigate to the Dynatrace Hub and activate the Microsoft Hyper-V Extension.
Do you keep an eye on the support of distributions and versions of operatingsystems within your environment? With this information, you can find answers to questions such as: Which operatingsystems and versions does Dynatrace support? Which operatingsystems and versions does Dynatrace support?
We’re happy to announce the launch of Dynatrace Synthetic private browser monitors! We continue to grow our public synthetic monitoring locations, but customers using Dynatrace Synthetic still need to monitor the performance and availability of internal web applications. Monitor your internal apps from within your offices.
Many customers try to use traditional tools to monitor and observe modern software stacks, but they struggle to deal with the dynamic and changing nature of cloud environments. When an application runs on a single large computing element, a single operatingsystem can monitor every aspect of the system.
A message queue is a form of middleware used in software development to enable communications between services, programs, and dissimilar components, such as operatingsystems and communication protocols. A message queue enables the smooth flow of information to make complex systems work. What is a message queue?
A message queue is a form of middleware used in software development to enable communications between services, programs, and dissimilar components, such as operatingsystems and communication protocols. A message queue enables the smooth flow of information to make complex systems work. What is a message queue?
As we did with IBM Power , we’re delighted to share that IBM and Dynatrace have joined forces to bring the Dynatrace Operator, along with the comprehensive capabilities of the Dynatrace platform, to Red Hat OpenShift on the IBM Z and LinuxONE architecture (s390x). This is significant when coupled with the OpenShift platform.
Traditional computing models rely on virtual or physical machines, where each instance includes a complete operatingsystem, CPU cycles, and memory. There is no need to plan for extra resources, update operatingsystems, or install frameworks. The provider is essentially your system administrator.
Our Premium High Availability comes with the following features: Active-active deployment model for optimum hardware utilization. Near-zero RPO and RTO—monitoring continues seamlessly and without data loss in failover scenarios. Achieve high SLOs with seamless monitoring when entire data centers experience outages.
Container-based software isn’t tied to a platform or operatingsystem, so IT teams can move or reconfigure processes easily. In FaaS environments, providers manage all the hardware. Alternatively, in a CaaS model, businesses can directly access and manage containers on hardware. Process portability. CaaS vs. FaaS.
Having released this functionality in an Early Adopter Release with OneAgent version 1.173 and Dynatrace version 1.174 back in August 2019, we’re now happy to announce the General Availability of OneAgent full-stack monitoring for Linux on the IBM Z platform, sometimes informally referred to as Z/Linux. What’s included.
But with the benefits also come concerns about observability, and how to monitor and manage ever-expanding cloud software stacks. You will likely need to write code to integrate systems and handle complex tasks or incoming network requests. How do AWS Lambda functions impact monitoring? The Amazon Web Services ecosystem.
With 99% of organizations using multicloud environments , effectively monitoring cloud operations with AI-driven analytics and automation is critical. IT operations analytics (ITOA) with artificial intelligence (AI) capabilities supports faster cloud deployment of digital products and services and trusted business insights.
Think of containers as the packaging for microservices that separate the content from its environment – the underlying operatingsystem and infrastructure. Built-in monitoring. Needs third party tools for monitoring. Needs third party tools for monitoring. In production, containers are easy to replicate.
They need specialized hardware, access to petabytes of images, and digital content creation applications with controlled licenses. We needed a system that could manage hundreds to one-day thousands of workstations. We use Salt to make operatingsystem agnostic declarative statements about how to configure a workstation.
Observability differs from monitoring. In a monitoring scenario, teams typically preconfigure dashboards to alert about performance issues they may expect to see later. Cloud-native environments don’t lend themselves well to this type of monitoring.
In todays data-driven world, the ability to effectively monitor and manage data is of paramount importance. With its widespread use in modern application architectures, understanding the ins and outs of Redis monitoring is essential for any tech professional. Redis, a powerful in-memory data store, is no exception.
An always-on infrastructure provides the foundation for system availability that can deliver five-nines availability. Traditionally, teams achieve this high level of uptime using a combination of high-capacity hardware, system redundancy, and failover models. Integrate infrastructure monitoring on a single AIOps platform.
We’re happy to announce the Early Adopter Release of OneAgent full-stack monitoring for Linux on the IBM Z platform, sometimes informally referred to as Z/Linux (available with OneAgent version 1.173 and Dynatrace version 1.174). Mainframe monitoring is an area of significant investment for Dynatrace. What’s included.
The purpose of infrastructure as code is to enable developers or operations teams to automatically manage, monitor, and provision resources, rather than manually configure discrete hardware devices and operatingsystems. In response, Dynatrace introduced Monaco (Monitoring-as-code).
In today’s data-driven world, the ability to effectively monitor and manage data is of paramount importance. With its widespread use in modern application architectures, understanding the ins and outs of Redis® monitoring is essential for any tech professional. Redis®, a powerful in-memory data store, is no exception.
You will need to know which monitoring metrics for Redis to watch and a tool to monitor these critical server metrics to ensure its health. This blog post lists the important database metrics to monitor. It can achieve impressive performance, handling up to 50 million operations per second.
It also entails secure development practices, security monitoring and logging, compliance and governance, and incident response. Cloud application security practices enable organizations to follow secure coding practices, monitor and log activities for detection and response, comply with regulations, and develop incident response plans.
Setting up and monitoring these systems was pretty easy compared to today’s standards. There were no dynamic web applications or complex user scenarios to have to monitor. monitoring distributed systems becomes much more difficult to carry out and manage. What is a Distributed System? Heterogeneity.
When it comes to hardware support to mitigate software security issues, there is a significant gap between what is available in products today and known solutions. Attestation—Providing systems the means to attest or verify the integrity of their components. hardware support for malware detection/prevention).
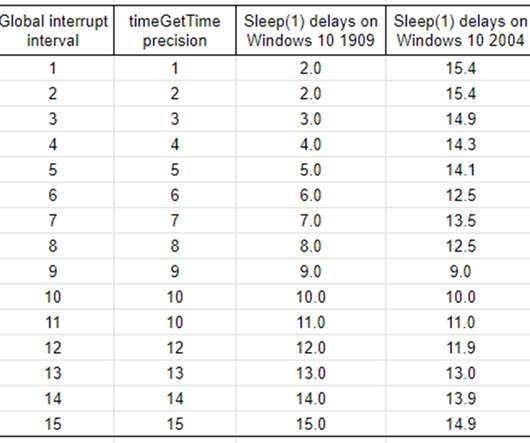
First, a bit of operating-system design context. Ideally the CPU goes to sleep when Sleep(1) is called, in order to save power, so how does the operatingsystem (OS) wake your thread if the CPU is sleeping? The answer is hardware interrupts. Timer interrupts and their raison d’être.
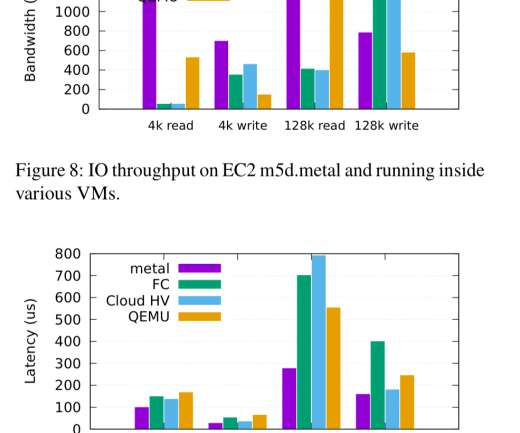
Firecracker is the virtual machine monitor (VMM) that powers AWS Lambda and AWS Fargate, and has been used in production at AWS since 2018. General-purpose hypervisors and virtual machine monitors (VMMs) are also quite large, leading to a large trusted compute base (TCB).
Key Takeaways Distributed storage systems benefit organizations by enhancing data availability, fault tolerance, and system scalability, leading to cost savings from reduced hardware needs, energy consumption, and personnel.
The censorship and monitoring of internet have evolved from anti-virus-like and firewall software to hardware security patches for all devices that uses internet. OperatingSystem Updates and Security Patches. All chat or messenger applications are also being monitored by the Great Firewall.
Because recognizing if the workload is read intensive or write intensive will impact your hardware choices, database configuration as well as what techniques you can apply for performance optimization and scalability. The illustrations below are taken from Percona Monitoring and Management (PMM) while running this benchmark.
These acronyms, which stand for real user monitoring and application performance monitoring, are software monitoring processes essential to measuring and evaluating applications in many different areas. What is real user monitoring (RUM)? What is application performance monitoring (APM)?
Using zswap means that no new hardware solutions are required, enabling rapid deployment across clusters. The best parameter configuration found by this process is periodically deployed to the WSC with a carefully monitored phased rollout. Memory pages moved to zswap are compressed (but the compressed pages stay in memory).
Let’s take a look at some of the best error monitoring tools and strategies for 2018. Error monitoring can get increasingly complicated as you deal with bugs reported by users and your production team, which is why having an efficient error tracking workflow from the beginning is so important. What is Error Tracking?
Key areas include: Configuration parameter tuning : This tuning involves altering variables such as memory allocation, disk I/O settings, and concurrent connections based on specific hardware and requirements. This not only results in cost savings by minimizing hardware requirements but also has the potential to decrease cloud expenses.
But for the uninitiated, on-premise testing is a form of testing where testers perform tests on local machines, systems, or devices set up at an office. From the maintenance and monitoring of the machines and software to upgrading and installations — you’ll need all hands on deck. As the name suggests, it happens on-premise.
Additionally, end users can access your site or applications from anywhere in the world using different browsers, operatingsystems, and mobile devices, all with varying connection speeds. Shift Right – Monitoring Performance after Deployment.
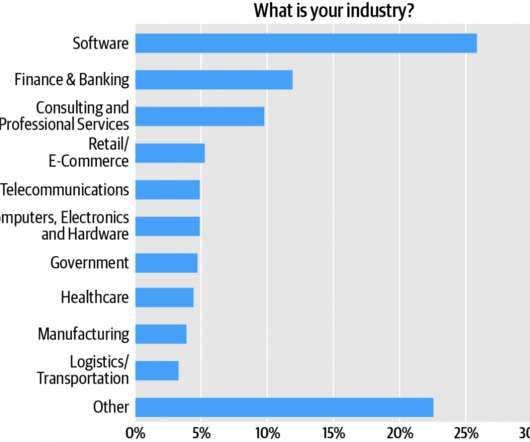
Combined, technology verticals—software, computers/hardware, and telecommunications—account for about 35% of the audience (Figure 2). It’s the kind of hard problem that cannot be wished, willed, or architected away–indeed, replacing a monolithic system with microservices can be seen as a “lump sum” payment of years of accrued technical debt.
Intuit, which is its parent business, oversees its operations. Because it utilizes multi-factor authentication, multi-layered hardware, and software encryption, the application offers its users a high degree of protection. The application is easily compatible with all the devices that use the Android operatingsystem.
In this blog post, we will discuss the best practices on the MongoDB ecosystem applied at the OperatingSystem (OS) and MongoDB levels. OperatingSystem (OS) settings Swappiness Swappiness is a Linux kernel setting that influences the behavior of the Virtual Memory manager when it needs to allocate a swap, ranging from 0-100.
Prior to SQL Server 2012, the maximum server memory value only applied to the bufferpool, so customers needed to limit the amount of memory the bufferpool could use to save memory for the operatingsystem and other processes. If you have big physical hardware with defaults, then you should look at optimizing MAXDOP.
are monitored; hence it is useful in finding out when the application will degrade. How well the application accommodates the changes and updates done on the code or system, comes under maintainability testing. Performance Testing- The performance of the application is measured while subjecting the application to real-world conditions.
Understanding DBaaS DBaaS cloud services allow users to use databases without configuring physical hardware and infrastructure or installing software. These may be performance, high availability, operational cost, management, capacity planning, scalability, security, monitoring, etc.
Whether it’s your TV, audio system, digital home assistant, or refrigerator chances are those devices run an operatingsystem such as Android allowing you access to the device’s features through apps. Crashes sometimes happen because of a specific combination of hardware, software and the environment (e.g.,
We organize all of the trending information in your field so you don't have to. Join 5,000+ users and stay up to date on the latest articles your peers are reading.
You know about us, now we want to get to know you!
Let's personalize your content
Let's get even more personalized
We recognize your account from another site in our network, please click 'Send Email' below to continue with verifying your account and setting a password.


Let's personalize your content