Remove Hardware Remove Latency Remove Metrics
article thumbnail

Seeing through hardware counters: a journey to threefold performance increase

The Netflix TechBlog

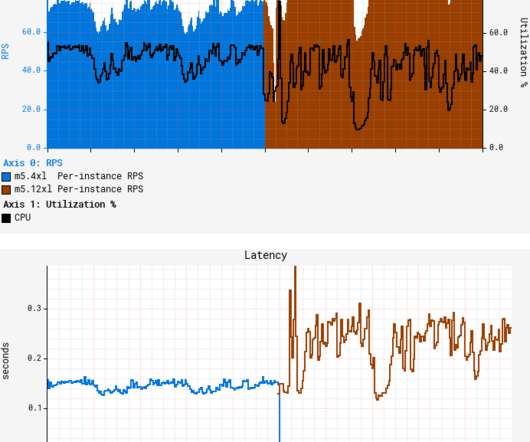
A quick canary test was free of errors and showed lower latency, which is expected given that our standard canary setup routes an equal amount of traffic to both the baseline running on 4xl and the canary on 12xl. What’s worse, average latency degraded by more than 50%, with both CPU and latency patterns becoming more “choppy.”

Hardware 363
article thumbnail

What is observability? Not just logs, metrics and traces

Dynatrace

In IT and cloud computing, observability is the ability to measure a system’s current state based on the data it generates, such as logs, metrics, and traces. If you’ve read about observability, you likely know that collecting the measurements of logs, metrics, and distributed traces are the three key pillars to achieving success.

Metrics 363
Insiders

Sign Up for our Newsletter

This site is protected by reCAPTCHA and the Google Privacy Policy and Terms of Service apply.

article thumbnail

Dynatrace Managed turnkey Premium High Availability for globally distributed data centers (Early Adopter)

Dynatrace

Dynatrace Managed is intrinsically highly available as it stores three copies of all events, user sessions, and metrics across its cluster nodes. The network latency between cluster nodes should be around 10 ms or less. Save on costs for hardware and network bandwidth to optimize total cost of ownership.

article thumbnail

Crucial Redis Monitoring Metrics You Must Watch

Scalegrid

You will need to know which monitoring metrics for Redis to watch and a tool to monitor these critical server metrics to ensure its health. Redis returns a big list of database metrics when you run the info command on the Redis shell. You can pick a smart selection of relevant metrics from these.

Metrics 130
article thumbnail

Time to First Byte: What It Is and Why It Matters

CSS Wizardry

However, one metric I feel that front-end developers overlook all too quickly is Time to First Byte (TTFB). The first—and often most surprising for people to learn—thing that I want to draw your attention to is that TTFB counts one whole round trip of latency. can all provide valuable insights. But what else is TTFB?

Latency 271
article thumbnail

What is serverless computing? Driving efficiency without sacrificing observability

Dynatrace

This allows teams to sidestep much of the cost and time associated with managing hardware, platforms, and operating systems on-premises, while also gaining the flexibility to scale rapidly and efficiently. When an application is triggered, it can cause latency as the application starts. This creates latency when they need to restart.

article thumbnail

Cloud infrastructure monitoring in action: Dynatrace on Dynatrace

Dynatrace

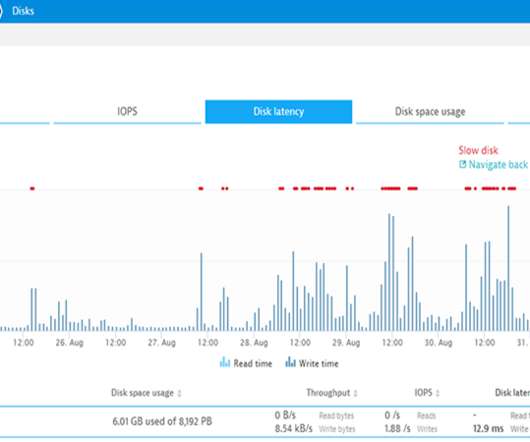
Sydney, we have a disk write latency problem! It was on August 25 th at 14:00 when Davis initially alerted on a disk write latency issues to Elastic File System (EFS) on one of our EC2 instances in AWS’s Sydney Data Center. The AWS team confirmed a known hardware issue affecting a certain amount of EC2 machines in that region.