This site uses cookies to improve your experience. To help us insure we adhere to various privacy regulations, please select your country/region of residence. If you do not select a country, we will assume you are from the United States. Select your Cookie Settings or view our Privacy Policy and Terms of Use.
Cookie Settings
Cookies and similar technologies are used on this website for proper function of the website, for tracking performance analytics and for marketing purposes. We and some of our third-party providers may use cookie data for various purposes. Please review the cookie settings below and choose your preference.
Used for the proper function of the website
Used for monitoring website traffic and interactions
Cookie Settings
Cookies and similar technologies are used on this website for proper function of the website, for tracking performance analytics and for marketing purposes. We and some of our third-party providers may use cookie data for various purposes. Please review the cookie settings below and choose your preference.
Strictly Necessary: Used for the proper function of the website
Performance/Analytics: Used for monitoring website traffic and interactions
Then, boom a performance or availability issue pops up. Google Gemini Code Assist can help to fix that. Together with the upcoming Dynatrace plugin for Gemini Code Assist, it keeps developers inside their editor and surfaces real-time performance and availability problems with their root cause all without breaking focus.
In this blog, I'll describe a couple of new performance features that you'll find in Postgres 17 as well as another important logical replication feature that I didn't cover in my earlier blog of this series. After a successful 3rd beta in August 2024, the PostgreSQL development group released the GA version on September 26th.
The annual Google Cloud Next conference explores the latest innovations for cloud technology and Google Cloud. This year, Google’s event will take place from April 9 to 11 in Las Vegas. Google Cloud users will come together to learn from Google experts and partners on topics from generative AI to cloud operations and security.
In recent years, function-as-a-service (FaaS) platforms such as Google Cloud Functions (GCF) have gained popularity as an easy way to run code in a highly available, fault-tolerant serverless environment. What is Google Cloud Functions? Google Cloud Functions is a serverless compute service for creating and launching microservices.
As a leader in cloud infrastructure and platform services , the Google Cloud Platform is fast becoming an integral part of many enterprises’ cloud strategies. However, as businesses migrate to the Google Cloud Platform, they’re faced with even more complex, distributed environments that are inherently difficult to observe and operate.
However, with these benefits come complexities in terms of cloud management, Kubernetes observability, and automation, making it imperative for enterprises to address these intricacies to enhance reliability, performance, and resource usage. Watch the “ Dynatrace and Google Cloud: Intelligent Kubernetes Observability and Automation ” webinar.
Dynatrace has announced that it has successfully achieved the Google Cloud Ready – Cloud SQL designation for Cloud SQL, Google Cloud’s fully-managed, relational database service for MySQL, PostgreSQL, and SQL Server. The post Dynatrace achieves Google Cloud Ready – Cloud SQL designation appeared first on Dynatrace news.
We’ll look at lifecycle management and then move on to tracing, while sharing some exciting announcements about Google Kubernetes Engine along the way. As I hinted in the opening paragraph, the OneAgent Helm chart also unlocks some important marketplace integrations, most notably the GCP marketplace for Google Kubernetes Engine.
Cloud-native observability for Google’s fully managed GKE Autopilot clusters demands new methods of gathering metrics, traces, and logs for workloads, pods, and containers to enable better accessibility for operations teams. First, we create a small Kubernetes cluster in the Google Cloud Console. Minimal disk consumption.
Today, Dynatrace is announcing that it has successfully achieved Google Cloud Ready – AlloyDB designation in support of an extended integration to Google Cloud’s AlloyDB for PostgreSQL. Google Cloud Ready – AlloyDB is a new designation for the solutions of Google Cloud’s technology partners that integrate with AlloyDB.
But now, chat platforms like Telegram and Google Chat have become the preferred way to communicate. ChatOps integration between the Dynatrace observability and security platform and chat platforms like Telegram and Google Chat enables you to get updates and notifications about the performance and health of your systems right as they happen.
For a project member, when we heard about API performance tests. Do we always have some questions like what should our standard for API performance? How we can define an automation process for API performance tests? What are the tools we can use?
Let's kick off the new year by celebrating someone who has not just had a huge impact on web performance over the past few years, but who has even more exciting stuff in the works for the future: Annie Sullivan! Annie and her team navigate this arduous task with true passion for web performance and for improving the user experience.
When I founded Dynatrace, I aimed to bridge the gap between IT performance and user experience. Using causal AI, we identified and resolved performance issues automatically. With these insights, you can act on improving the reliability, performance, and user experience of your entire customer journey. Google or Adobe Analytics).
Find and prevent application performance risks A major challenge for DevOps and security teams is responding to outages or poor application performance fast enough to maintain normal service. It should also be possible to analyze data in context to proactively address events, optimize performance, and remediate issues in real time.
Outages on the Internet always catch you by surprise, whether you are the end user or the Head of Site Reliability trying to keep a clear mind while you execute your incident playbook.
The second day of Dynatrace Perform kicked off with a great discussion between Kelsey Hightower, distinguished developer advocate at Google Cloud Platform, and Andi Grabner, DevOps evangelist at Dynatrace. The theme of their discussion was redefining the boundaries of people, processes, and platforms.
Google has a pretty tight grip on the tech industry: it makes by far the most popular browser with the best DevTools, and the most popular search engine, which means that web developers spend most of their time in Chrome, most of their visitors are in Chrome, and a lot of their search traffic will be coming from Google. It’s vital.
Google added another book into their excellent SRE series: Building Secure and Reliable Systems. Copy/pasting a few paragraphs: "In this book we talk generally about systems, which is a conceptual way of thinking about the groups of components that cooperate to perform some function. Google has problems, just like you.
Originally developed by engineers at Google, K8s has achieved global fame as the go-to solution for hosting across on-premise, public, private, or hybrid clouds. Kubernetes (also called K8s) remains the most in-demand container for developers.
One key factor that significantly affects the performance of data processing is the storage format of the data. This article explores the impact of different storage formats, specifically Parquet, Avro, and ORC on query performance and costs in big data environments on Google Cloud Platform (GCP).
With our annual user conference, Dynatrace Perform 2024 rapidly approaching on January 29 through February 1, 2024, our teams, partners, and customers are buzzing with excitement and anticipation. Read on to learn what you can look forward to hearing about from each of our cloud partners at Perform. What can we move?
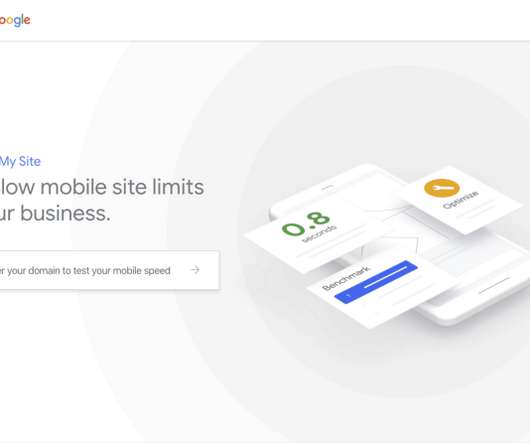
A website needs to be constantly tested and optimized to be in line with Google's web and SEO guidelines. However, to tactically assess the website's performance , it needs to be measured in a well-thought-out manner. This article will learn about web performance testing and how Core Web Vitals plays a crucial and strategic part in it.
GCP (Google Cloud Platform) provides a comprehensive set of cloud services for developing, deploying, and managing applications and infrastructure. To maintain the performance, security, and cost-effectiveness of your cloud-based resources, robust logging and monitoring are required.
Echoing John Van Siclen’s sentiments from his Perform 2020 keynote, Steve cited Dynatrace customers as the inspiration and driving force for these innovations. “A Highlighting the company’s announcements from Perform 2020, Steve and a team of other Dynatrace product leaders introduced the audience to several of our latest innovations.
Web Performance is important for user experience and business metrics. This post explains several ways of assessing the potential performance gains with little effort and, more importantly, without actually implementing fixes. What is the business opportunity for web performance improvements? I would repeat over and over.
Let me address that by combining my two favourite topics: CSS and performance. It’s really, really bad for Start Render performance. The introduction of the Preload Scanner improved web page performance by around 19%, all without developers having to lift a finger. What’s the Big Problem? Avoid using @import in your CSS files.
Here’s a quick look at what’s new this month: MongoDB Now on AWS, Azure, and Google Cloud We’re excited to announce that you can now deploy and manage MongoDB clusters on AWS, Azure, and Google Cloud. These changes improve the stability and performance of your deployments.
How To Use Google CrUX To Analyze And Compare The Performance Of JS Frameworks. How To Use Google CrUX To Analyze And Compare The Performance Of JS Frameworks. In particular, the increase in the amount of downloaded JavaScript can have a direct impact on website performance. Dan Shappir. 2022-05-12T09:30:00+00:00.
At Dynatrace Perform 2022 in February, the theme was “Empowering the game changers.”. In addition to existing support for AWS Lambda , this expansion includes Microsoft Azure Functions, Google Cloud Functions, as well as managed Kubernetes environments, messaging queues, and cloud databases across all major cloud providers.
Synthetic monitors are also the perfect tool to monitor performance baselines. This clean-room, lab-like environment allows you to react to slight changes in performance. It also gives you the first indication of whether a new deployment of your application or API leads to a performance improvement or, perhaps, a regression.
What I got back were two artifacts, one of them being the following video of Akamai web performance expert Robin Marx speaking at We Love Speed in France a few weeks ago: The other artifact is a Google document originally published by Patrick Meenan in 2015 but updated somewhat recently in November 2023.
In this blog, I will be going through a step-by-step guide on how to automate SRE-driven performance engineering. Step-by-step guide: SRE-driven performance analysis with Dynatrace. Dynatrace news. Keptn uses SLO definitions to automatically configure Dynatrace or Prometheus alerting rules. This is what this blog is all about.
This article explores SLOs for service performance. According to the Google Site Reliability Engineering (SRE) handbook, monitoring the four golden signals is crucial in delivering high-performing software solutions. SLOs, as a measure of service quality, can track the related availability, reliability, and performance.
Particularly during the COVID-19 pandemic, we’ve seen how poor application performance can impact business bottom lines and lead to lost revenue for many organizations, as laid out in our recent blog post about digital experience. by Google Core Web Vitals is?certainly?valuable,?it?leaves Google Search Console?
When it comes to mobile monitoring, everyone has their own point of view… Mobile is not a single technology: it involves different development teams handling Android and iOS apps, performance engineering teams, cloud operations, and marketing. How do I connect the dots between mobile analytics and performance monitoring?
At our virtual conference, Dynatrace Perform 2022 , the theme is “Empowering the game changers.”. Empowering the game changers at Dynatrace Perform 2022. While conventional monitoring scans the environment using correlation and statistics, it provides little contextual information for remediating performance or security issues.
According to netmarketshare , Google Chrome accounts for 67% of the browser market share. This is why, as an automation tester, it is important that you perform automated browser testing on Chrome browser. It is the choice of the majority of users and it’s popularity continues to rise.
I recently joined two industry veterans and Dynatrace partners, Syed Husain of Orasi and Paul Bruce of Neotys as panelists to discuss how performance engineering and test strategies have evolved as it pertains to customer experience. What do you see as the biggest challenge for performance and reliability? Dynatrace news.
These contracts will shine a spotlight on the need to optimize cloud performance and security. With optimized cloud performance, they make better decisions in minutes or even seconds. Dynatrace delivers optimal cloud performance through observability As in the private sector, the U.S. JWCC won’t be mandatory.
Day two of Dynatrace Perform began with a great discussion between Kelsey Hightower , Distinguished Developer Advocate at Google Cloud Platform and Andi Grabner , DevOps Evangelist at Dynatrace. The theme of their discussion was redefining the boundaries of people, processes and platforms.
How To Monitor And Optimize Google Core Web Vitals How To Monitor And Optimize Google Core Web Vitals Matt Zeunert 2024-04-16T10:00:00+00:00 2024-04-16T12:05:36+00:00 This article is sponsored by DebugBear Google’s Core Web Vitals initiative has increased the attention website owners need to pay to user experience.
by Jason Koch , with Martin Spier , Brendan Gregg , Ed Hunter Improving the tools available to our engineers to help them diagnose, triage, and work through software performance challenges in the cloud is a key goal for the cloud performance engineering team at Netflix. 10–20 MB/sec (it is, unsurprisingly, receiving lots of data).
You’re optimizing the performance of some website, scrutinizing every millisecond it takes for the current page to load. You’ve fired up Google Lighthouse from Chrome’s DevTools because everyone and their uncle uses it to evaluate performance. Except, don’t — at least not using Google Lighthouse as your sole proof.
We organize all of the trending information in your field so you don't have to. Join 5,000+ users and stay up to date on the latest articles your peers are reading.
You know about us, now we want to get to know you!
Let's personalize your content
Let's get even more personalized
We recognize your account from another site in our network, please click 'Send Email' below to continue with verifying your account and setting a password.


Let's personalize your content