This site uses cookies to improve your experience. To help us insure we adhere to various privacy regulations, please select your country/region of residence. If you do not select a country, we will assume you are from the United States. Select your Cookie Settings or view our Privacy Policy and Terms of Use.
Cookie Settings
Cookies and similar technologies are used on this website for proper function of the website, for tracking performance analytics and for marketing purposes. We and some of our third-party providers may use cookie data for various purposes. Please review the cookie settings below and choose your preference.
Used for the proper function of the website
Used for monitoring website traffic and interactions
Cookie Settings
Cookies and similar technologies are used on this website for proper function of the website, for tracking performance analytics and for marketing purposes. We and some of our third-party providers may use cookie data for various purposes. Please review the cookie settings below and choose your preference.
Strictly Necessary: Used for the proper function of the website
Performance/Analytics: Used for monitoring website traffic and interactions
Google has a pretty tight grip on the tech industry: it makes by far the most popular browser with the best DevTools, and the most popular search engine, which means that web developers spend most of their time in Chrome, most of their visitors are in Chrome, and a lot of their search traffic will be coming from Google. It’s vital.
Let me address that by combining my two favourite topics: CSS and performance. In this post I want to look at how CSS can prove to be a substantial bottleneck on the network (both in itself and for other resources) and how we can mitigate it, thus shortening the Critical Path and reducing our time to Start Render. Employ Critical CSS.
Find and prevent application performance risks A major challenge for DevOps and security teams is responding to outages or poor application performance fast enough to maintain normal service. It should also be possible to analyze data in context to proactively address events, optimize performance, and remediate issues in real time.
Let's kick off the new year by celebrating someone who has not just had a huge impact on web performance over the past few years, but who has even more exciting stuff in the works for the future: Annie Sullivan! Annie and her team navigate this arduous task with true passion for web performance and for improving the user experience.
SpeedTest, Speed from Cloudflare , Netflix's Fast , or if you use Google search , you can test the internet speed and its analytics. In this blog article, we will deep dive into network quality and its usage. There are umpteen tools available to check the internet speed. Launching networkQuality.
Web Performance is not only about understanding what makes a site fast. Performance is a feature and needs to be prioritized as such. Performance is a topic that has interested me for a long time. Moving over to web, the performance problems are different. This is not a post explaining why web performance is important.
Particularly during the COVID-19 pandemic, we’ve seen how poor application performance can impact business bottom lines and lead to lost revenue for many organizations, as laid out in our recent blog post about digital experience. by Google Core Web Vitals is?certainly?valuable,?it?leaves Google Search Console?
HTML – Typically the smallest resource on the page, HTML's performance risk is usually negligible. JavaScript – A page can have a relatively low JS weight but still suffer from JS-inflicted performance problems. Core Web Vitals are a Google search ranking factor. The more scripts on your page, the greater the risk.
Just as people use Xerox as shorthand for paper copies and say “Google” instead of internet search, Docker has become synonymous with containers. These mechanisms are often compared to a conductor directing an orchestra to perform elaborate symphonies and juicy operas for our enjoyment. Networking. What is Docker?
When it comes to mobile monitoring, everyone has their own point of view… Mobile is not a single technology: it involves different development teams handling Android and iOS apps, performance engineering teams, cloud operations, and marketing. How do I connect the dots between mobile analytics and performance monitoring?
What I got back were two artifacts, one of them being the following video of Akamai web performance expert Robin Marx speaking at We Love Speed in France a few weeks ago: The other artifact is a Google document originally published by Patrick Meenan in 2015 but updated somewhat recently in November 2023.
These include traditional on-premises network devices and servers for infrastructure applications like databases, websites, or email. You also might be required to capture syslog messages from cloud services on AWS, Azure, and Google Cloud related to resource provisioning, scaling, and security events.
There are a lot of cool nuggets in Google's New Book: The Site Reliability Workbook. In addition, many engineers across Google provided their assis? As shown in Figure 11-5, when it launched, Pokémon GO used Google’s regional Network Load Balancer (NLB) to load-balance ingress traffic across a Kubernetes cluster.
You’re optimizing the performance of some website, scrutinizing every millisecond it takes for the current page to load. You’ve fired up Google Lighthouse from Chrome’s DevTools because everyone and their uncle uses it to evaluate performance. Except, don’t — at least not using Google Lighthouse as your sole proof.
I never thought I’d write an article in defence of DOMContentLoaded , but here it is… For many, many years now, performance engineers have been making a concerted effort to move away from technical metrics such as Load , and toward more user-facing, UX metrics such as Speed Index or Largest Contentful Paint. performance. performance.
How To Monitor And Optimize Google Core Web Vitals How To Monitor And Optimize Google Core Web Vitals Matt Zeunert 2024-04-16T10:00:00+00:00 2024-04-16T12:05:36+00:00 This article is sponsored by DebugBear Google’s Core Web Vitals initiative has increased the attention website owners need to pay to user experience.
by Jason Koch , with Martin Spier , Brendan Gregg , Ed Hunter Improving the tools available to our engineers to help them diagnose, triage, and work through software performance challenges in the cloud is a key goal for the cloud performance engineering team at Netflix. 10–20 MB/sec (it is, unsurprisingly, receiving lots of data).
As monolithic applications have given way to cloud-connected microservices that perform distinct functions, containerized environments, such as the Kubernetes platform, have become the framework of choice. It controls the delivery of service requests to other services, performs load balancing, encrypts data, and discovers other services.
The framework comprises six pillars: Operational Excellence, Security, Reliability, Performance Efficiency, Cost Optimization, and Sustainability. And how can you verify this performance consistently across a multicloud environment that also uses Microsoft Azure and Google Cloud Platform frameworks?
Greenplum uses an MPP database design that can help you develop a scalable, high performance deployment. High performance, query optimization, open source and polymorphic data storage are the major Greenplum advantages. Here are some of the key Greenplum advantages that can help you improve your database performance: High Performance.
We love writing articles and blog posts that help folks solve real web performance and UX problems. Some of these articles come from our recently published Web Performance Guide – a collection of evergreen how-to resources (written by actual humans!) According to Google, a 'good' INP time is faster that 200 milliseconds.
” In recent years, cloud service providers such as Amazon Web Services, Microsoft Azure, IBM, and Google began offering Kubernetes as part of their managed services. The managed service runs on public clouds such as Amazon Web Services and Google Cloud. Networking. Kubernetes provides a basic networking model.
This operational data could be gathered from live running infrastructures using software agents, hypervisors, or network logs, for example. This enables AIOps teams to better predict performance and security issues and improve overall IT operations. Operations analytics ensures IT systems perform as expected. NoSQL database.
However, when looking at Googles Core Web Vitals , TTFB starts from the time when the users start navigating to a new page. Connecting to a server on the web typically takes three round trips on the network: DNS: Looking up the server IP address. These services provide a network of globally distributed server locations.
Here’s why: Complex configuration management 30% of all cloud environment attacks during the first half of 2024 used misconfigurations as the initial access vector” – Google Cloud Threat Horizons report. Grail allows for collaboration and remediation actions across multiple teams.
Improving The Performance Of Wix Websites (Case Study). Improving The Performance Of Wix Websites (Case Study). It was at this point that we realized we needed to make a significant change in our approach towards performance, and that we must embrace performance as part of our culture. Dan Shappir. Large preview ).
But managing the deployment, modification, networking, and scaling of multiple containers can quickly outstrip the capabilities of development and operations teams. This orchestration includes provisioning, scheduling, networking, ensuring availability, and monitoring container lifecycles. How does container orchestration work?
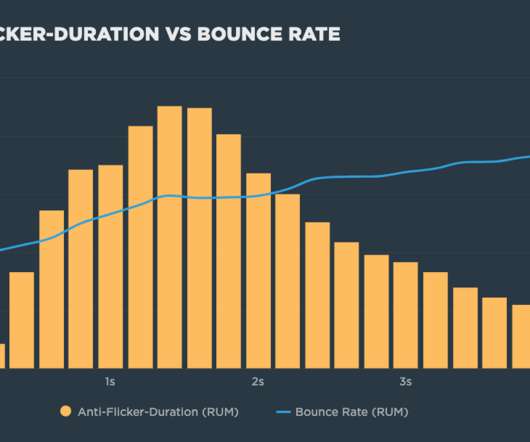
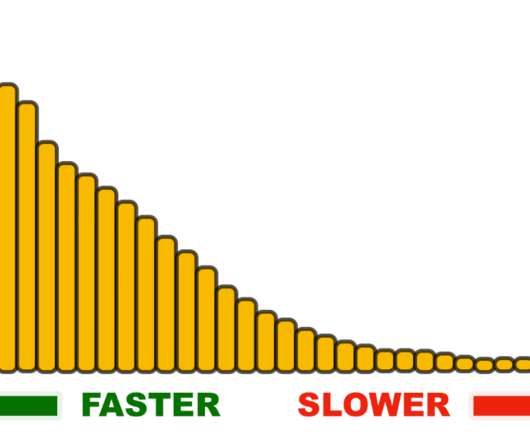
Experimentation tools that use asynchronous scripts – such as Google Optimize, Adobe Target, and Visual Web Optimizer – recommend using an anti-flicker snippet to hide the page until they've finished executing. Google Optimize) has finished applying its experiments. In Google Optimize's default case is the whole document.
Before an organization moves to function as a service, it’s important to understand how it works, its benefits and challenges, its effect on scalability, and why cloud-native observability is essential for attaining peak performance. Infrastructure as a service (IaaS) handles compute, storage, and network resources. What is FaaS?
A couple of years ago, my first few days on a new web performance project were always slow going. Unless a client hires you to specifically improve the performance of one page, you’ll need a broad view of the whole site or application. against many other metrics as other milestones (except CLS) are network-bound and TBT is CPU-bound.
Microservices are run using container-based orchestration platforms like Kubernetes and Docker or cloud-native function-as-a-service (FaaS) offerings like AWS Lambda, Azure Functions, and Google Cloud Functions, all of which help automate the process of managing microservices. Simple network calls. Potential for decreased reliability.
Microservices are run using container-based orchestration platforms like Kubernetes and Docker or cloud-native function-as-a-service (FaaS) offerings like AWS Lambda, Azure Functions, and Google Cloud Functions, all of which help automate the process of managing microservices. Simple network calls. Potential for decreased reliability.
Snap: a microkernel approach to host networking Marty et al., This paper describes the networking stack, Snap , that has been running in production at Google for the last three years+. Enter Google! Upgrades are performed incrementally, one engine at a time. SOSP’19. It reminds me of ZeroMQ.
On Sunday June 2nd, Google Cloud Platform had an extended networking-based outage. There was significant disruption of commonly used services like YouTube and Gmail, as well as Google-hosted applications like Snapchat. Previously we've written about having hard conversations with cloud providers.
In a Dynatrace Perform 2024 session, Kristof Renders, director of innovation services, discussed how a stronger FinOps strategy coupled with observability can make a significant difference in helping teams to keep spiraling infrastructure costs under control and manage cloud spending. Wrong-sized resources. Unnecessary data transfer.
According to Forrester Research, the COVID-19 pandemic fueled investment in “hyperscaler public clouds”—Amazon Web Services (AWS), Google Cloud Platform and Microsoft Azure. According to a data from Dimensional Research, 95% of respondents say visibility problems have prompted an application or networkperformance issue.
We often hear how special, generous, and supportive the web performance community is. Sergey is a well-known early champion of web performance and user experience. Back in 2009, he started the first web performance meetup group in New York City, which is still running strong today. This didn't happen overnight.
Software analytics enables software automation Software analytics enables software automation with targeted machine learning and AI algorithms that mimic the way humans think to perform repetitive tasks. These algorithms analyze massive amounts of complex structured and unstructured data to enhance human decision making and performance.
Performance: Is the interaction seamless and fast as possible, or does the user always have to wait to achieve their goal? You have to be aware that at any of your digital touchpoints, the digital experience is measured against the best-in-class available coming from Google, Facebook and other digital leaders.
With so many of their transactions occurring online, customers are becoming more demanding, expecting websites and applications to always perform perfectly. There are now many more applications, tools, and infrastructure variables that impact an application’s performance and availability.
Amazon Web Services (AWS) Outpost : This offering provides pre-configured hardware and software for customers to run native AWS computing, networking, and services on-premises in a cloud-native manner. After deployment, IT teams can also optimize the software and supporting hardware to ensure high performance.
This multinational information technology service and consulting company was asked to help a global automotive manufacturer with the management goal of measuring service flow performance. This represents the total number of requests across the network. This refers to the load on your network and servers. Saturation.
You may be using serverless functions like AWS Lambda , Azure Functions , or Google Cloud Functions, or a container management service, such as Kubernetes. The components of partitioned applications generally communicate over a network call. 5 challenges to achieving observability at scale. Read eBook now!
I love conversations about performance, and I'm fortunate enough to have them a lot. I hope this post can serve that purpose and cover a few of the fundamental areas of web performance that I’ve found to be most useful while honing the craft of product management. How is performance measured? The audience varies.
We organize all of the trending information in your field so you don't have to. Join 5,000+ users and stay up to date on the latest articles your peers are reading.
You know about us, now we want to get to know you!
Let's personalize your content
Let's get even more personalized
We recognize your account from another site in our network, please click 'Send Email' below to continue with verifying your account and setting a password.


Let's personalize your content