This site uses cookies to improve your experience. To help us insure we adhere to various privacy regulations, please select your country/region of residence. If you do not select a country, we will assume you are from the United States. Select your Cookie Settings or view our Privacy Policy and Terms of Use.
Cookie Settings
Cookies and similar technologies are used on this website for proper function of the website, for tracking performance analytics and for marketing purposes. We and some of our third-party providers may use cookie data for various purposes. Please review the cookie settings below and choose your preference.
Used for the proper function of the website
Used for monitoring website traffic and interactions
Cookie Settings
Cookies and similar technologies are used on this website for proper function of the website, for tracking performance analytics and for marketing purposes. We and some of our third-party providers may use cookie data for various purposes. Please review the cookie settings below and choose your preference.
Strictly Necessary: Used for the proper function of the website
Performance/Analytics: Used for monitoring website traffic and interactions
The annual Google Cloud Next conference explores the latest innovations for cloud technology and Google Cloud. This year, Google’s event will take place from April 9 to 11 in Las Vegas. Google Cloud users will come together to learn from Google experts and partners on topics from generative AI to cloud operations and security.
In recent years, function-as-a-service (FaaS) platforms such as Google Cloud Functions (GCF) have gained popularity as an easy way to run code in a highly available, fault-tolerant serverless environment. What is Google Cloud Functions? Google Cloud Functions is a serverless compute service for creating and launching microservices.
As a leader in cloud infrastructure and platform services , the Google Cloud Platform is fast becoming an integral part of many enterprises’ cloud strategies. However, as businesses migrate to the Google Cloud Platform, they’re faced with even more complex, distributed environments that are inherently difficult to observe and operate.
In the webinar “ Intelligent Kubernetes observability and automation ,” Dynatrace expert Henrik Rexed and GCP experts Gari Singh and Alisha Stull provide insights into leveraging AI-powered observability and automation to gain granular insights into Kubernetes environments on Google Cloud Platform at an enterprise scale.
Dynatrace has announced that it has successfully achieved the Google Cloud Ready – Cloud SQL designation for Cloud SQL, Google Cloud’s fully-managed, relational database service for MySQL, PostgreSQL, and SQL Server.
Cloud-native observability for Google’s fully managed GKE Autopilot clusters demands new methods of gathering metrics, traces, and logs for workloads, pods, and containers to enable better accessibility for operations teams. First, we create a small Kubernetes cluster in the Google Cloud Console. Minimal disk consumption.
In October 2021, Dynatrace announced the availability of the Dynatrace Software Intelligence Platform on Google Cloud as a software as a service (SaaS) solution. Dynatrace and Google Cloud play a critical role in helping customers accelerate their digital transformation initiatives.
Our procurement decisions were based on trace data that was pulled from a handful of fragmented monitoring solutions. We’ll look at lifecycle management and then move on to tracing, while sharing some exciting announcements about Google Kubernetes Engine along the way. Rapid OneAgent rollouts on Google Kubernetes Engine.
October 14, 2020 – ScaleGrid, a leading Database-as-a-Service (DBaaS) provider, has just announced the launch of Google Cloud Platform (GCP) hosting through their fully managed DBaaS plans. Google Cloud Platform is the second most popular cloud provider for open source database hosting according to the 2019 Open Source Database Report.
On average, organizations use 10 different tools to monitor applications, infrastructure, and user experiences across these environments. Clearly, continuing to depend on siloed systems, disjointed monitoring tools, and manual analytics is no longer sustainable.
But now, chat platforms like Telegram and Google Chat have become the preferred way to communicate. The practice of ChatOps has now evolved beyond incident management to include tasks such as code deployment, monitoring, and automated incident response. By typing commands into the chat tool, teams can interact with these bots.
GCP (Google Cloud Platform) provides a comprehensive set of cloud services for developing, deploying, and managing applications and infrastructure. To maintain the performance, security, and cost-effectiveness of your cloud-based resources, robust logging and monitoring are required.
Recently, we’ve expanded our digital experience monitoring to cover the entire customer journey, from conversion to fulfillment. Consolidate real-user monitoring, synthetic monitoring, session replay, observability, and business process analytics tools into a unified platform. Google or Adobe Analytics).
Google has released a new book: The Site Reliability Workbook — Practical Ways to Implement SRE. David Rensin, a SRE at Google, says : It's a whole new book. Monitoring. It's the second book in their SRE series. How is it different than the previous Site Reliability Engineering book? Implementing SLOs. Alerting on SLOs.
Apache Flink monitoring support is now available in the open-source OpenTelemetry collector. Today we'll use observIQ’s OpenTelemetry distribution, and shipping Apache Flink telemetry to a popular backend: Google Cloud Ops. You can check out the OpenTelemetry repo here ! You can find out more on the GitHub page: [link]
How To Monitor And Optimize Google Core Web Vitals How To Monitor And Optimize Google Core Web Vitals Matt Zeunert 2024-04-16T10:00:00+00:00 2024-04-16T12:05:36+00:00 This article is sponsored by DebugBear Google’s Core Web Vitals initiative has increased the attention website owners need to pay to user experience.
Dynatrace Synthetic Monitoring allows you to proactively monitor the availability of your public as well as your internal web applications and API endpoints from locations around the globe or important internal locations such as branch offices. Synthetic monitors help you find issues before they affect your customers.
Confirgure Google Stackdriver and Bindplane to monitor your Active Directory What is Active Directory? Active Directory stores information about objects handled on a network and makes it easy for admins and other users to access and utilize the data.
This type of application (and organizational) independence gave application teams the freedom to choose whatever monitoring solutions they wanted since there was little advantage to having a cohesive solution that encompassed the entire enterprise. cloud services and third parties). OpenTracing + OpenCensus = OpenTelemetry.
Organizations can now accelerate innovation and reduce the risk of failed software releases by incorporating on-demand synthetic monitoring as a metrics provider for automatic, continuous release-validation processes. Dynatrace combines Synthetic Monitoring with automatic release validation for continuous quality assurance across the SDLC.
To provide “quality signals that are essential to delivering a great user experience on the web,” Google introduced their Core Web Vitals initiative last year, advocating the Largest contentful paint , Cumulative layout shift , and First input delay metrics. by Google Core Web Vitals is?certainly?valuable,?it?leaves
Run custom-built images as containers at scale with Google Cloud Run. The complexity of monitoring Cloud Run environments with heterogeneous stacks increases further when a platform auto -scal es deployments b ased on demand. . Automate white-box monitoring of Cloud Run applications with Dynatrace. What’s next.
If you use Windows, you will want to monitor Windows Events. A recent contribution of a distribution of the OpenTelemetry (OTel) Collector makes it much easier to monitor Windows Events with OpenTel. We will be shipping Windows Event logs to a popular backend: Google Cloud Ops. You can find out more on the GitHub page here.
With Dynatrace Synthetic you can easily create API tests with synthetic monitors. OAuth is an open standard for access delegation that is currently used by Amazon , Google , Microsoft , PayPal , Facebook , Twitter , and other companies. How to monitor an OAuth protected API with Dynatrace Synthetic. What is OAuth?
Today, Google announced virtual machines (VMs) based on the Arm architecture on Compute Engine called Tau T2A , which are optimized for cost-effective performance for scale-out workloads, as well as GKE Arm. As a close technology partner of GCP and a leader in Kubernetes monitoring, we’re excited to be a launch partner.
While to-date it’s been possible to integrate Dynatrace Managed for intelligent monitoring of services running on AWS and Azure, today we’re excited to announce the release of our Dynatrace Managed marketplace listing for the Google Cloud Platform. Dynatrace Managed now available on the Google Cloud Platform.
Although some people may think of observability as a buzzword for sophisticated application performance monitoring (APM) , there are a few key distinctions to keep in mind when comparing observability and monitoring. What is the difference between monitoring and observability? Is observability really monitoring by another name?
Just as people use Xerox as shorthand for paper copies and say “Google” instead of internet search, Docker has become synonymous with containers. Initially developed by Google, it’s now available in many distributions and widely supported by all public cloud vendors. Built-in monitoring. What is Docker?
Complex syslog ecosystems can be challenging Monitoring devices and applications that provide output via the syslog protocol is a must-have for many organizations. You also might be required to capture syslog messages from cloud services on AWS, Azure, and Google Cloud related to resource provisioning, scaling, and security events.
I’m willing to bet you still monitor TTFB , even though you know your customers will have no concept of a first byte whatsoever. If you aren’t (able to) monitoring custom metrics around your application’s interactivity, hydration state, etc., Google Analytics Until recently , Google Analytics also surfaces DOMContentLoaded information.
These functions are executed by a serverless platform or provider (such as AWS Lambda, Azure Functions or Google Cloud Functions) that manages the underlying infrastructure, scaling and billing. Connect Dynatrace to your cloud-vendor to gather relevant infrastructure monitoring data, which gives you essential health insights.
The Dynatrace CSPM solution significantly enhances security, compliance, and resource efficiency through continuous monitoring, automated remediation, and centralized visibility for enterprises managing complex hybrid and multicloud environments. Automation and continuous monitoring. The solution?
Although the APIs were all managed by the Google API manager Apigee, the bank group was not getting consistent data types from the output. This restriction made it impossible to totally export all traces from Apigee unless the sampling rate was below the maximum, in which case they could use Google Cloud Trace.
At this year’s Perform, we are thrilled to have our three strategic cloud partners, Amazon Web Services (AWS), Microsoft Azure, and Google Cloud Platform (GCP), returning as both sponsors and presenters to share their expertise about cloud modernization and observability of generative AI models.
Core Web Vitals are a Google search ranking factor. Given that Google continues to dominate search usage, you should care about Vitals alongside the other metrics you should be tracking. Image size is another issue, as excessive image weight hurts your SEO ranking in Google Image Search. How does page bloat hurt Core Web Vitals?
Kubernetes (k8s) provides basic monitoring through the Kubernetes API and you can find instructions like Top 9 Open Source Tools for Monitoring Kubernetes as a “do it yourself guide”. End-user monitoring. 4 AWS EFS monitoring. Dynatrace news. Full-stack observability. End-to-end code-level tracing. Service mash insights.
You’ve fired up Google Lighthouse from Chrome’s DevTools because everyone and their uncle uses it to evaluate performance. Except, don’t — at least not using Google Lighthouse as your sole proof. Google Lighthouse is merely one tool in a complete performance toolkit. That’s what we’re aiming for, after all! What services?
The key to accomplishing both these goals is having effective mobile app monitoring that quickly identifies the root cause of performance issues. However, because organizations typically use multiple mobile monitoring tools, this process is often far more difficult than it should be. Organizations use multiple mobile monitoring tools.
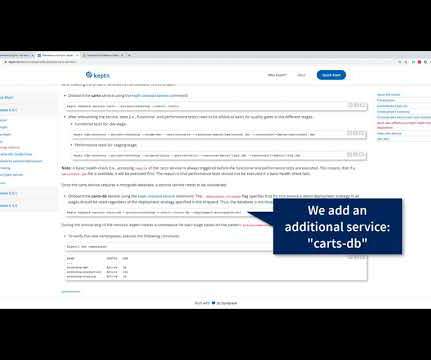
To get started – just follow the new Keptn Quickstart with a special gift from our friends at Google Cloud Platform! We want to say “Thank you Google” for your support on our mission towards Autonomous Cloud and helping us grow the user base of Keptn! Keptn Quickstart on GKE with $500 GCP credits.
Organizations are constantly being measured against the best available digital experiences — coming from Google, Amazon, Facebook, and other industry leaders. Monitoring digital experiences has become increasingly critical for organizations to maintain their competitive edge. What is digital experience monitoring?
And how can you verify this performance consistently across a multicloud environment that also uses Microsoft Azure and Google Cloud Platform frameworks? But how can you ensure that your applications meet these pillars and deliver the best outcomes for your business?
How is monitoring different from observability? In the mid 2000s, Google published their Dapper paper which describes techniques for distributed tracing at Google. Today, distributed tracing is state-of-the-art, and most performance monitoring solutions support at least a flavor of it. Observability vs. monitoring.
Hundreds of thousands of companies use Google Cloud’s GKE to build and run their applications. Advancing a cool component to the mix, did you know Google Cloud does all the manual work and more with GKE Autopilot ? Dynatrace makes monitoring your Kubernetes infrastructure — and everything else in your cloud environment — simple.
Splunk, when it was first released, was known as Google Search for logs, and it was followed by others such as Elasticsearch and Sumo Logic. With the advent of Kubernetes, cloud-native development, and distributed architectures, things have changed a lot.
We organize all of the trending information in your field so you don't have to. Join 5,000+ users and stay up to date on the latest articles your peers are reading.
You know about us, now we want to get to know you!
Let's personalize your content
Let's get even more personalized
We recognize your account from another site in our network, please click 'Send Email' below to continue with verifying your account and setting a password.


Let's personalize your content