This site uses cookies to improve your experience. To help us insure we adhere to various privacy regulations, please select your country/region of residence. If you do not select a country, we will assume you are from the United States. Select your Cookie Settings or view our Privacy Policy and Terms of Use.
Cookie Settings
Cookies and similar technologies are used on this website for proper function of the website, for tracking performance analytics and for marketing purposes. We and some of our third-party providers may use cookie data for various purposes. Please review the cookie settings below and choose your preference.
Used for the proper function of the website
Used for monitoring website traffic and interactions
Cookie Settings
Cookies and similar technologies are used on this website for proper function of the website, for tracking performance analytics and for marketing purposes. We and some of our third-party providers may use cookie data for various purposes. Please review the cookie settings below and choose your preference.
Strictly Necessary: Used for the proper function of the website
Performance/Analytics: Used for monitoring website traffic and interactions
The annual Google Cloud Next conference explores the latest innovations for cloud technology and Google Cloud. This year, Google’s event will take place from April 9 to 11 in Las Vegas. Google Cloud users will come together to learn from Google experts and partners on topics from generative AI to cloud operations and security.
Today, Dynatrace is announcing that it has successfully achieved Google Cloud Ready – AlloyDB designation in support of an extended integration to Google Cloud’s AlloyDB for PostgreSQL. Google Cloud Ready – AlloyDB is a new designation for the solutions of Google Cloud’s technology partners that integrate with AlloyDB.
In recent years, function-as-a-service (FaaS) platforms such as Google Cloud Functions (GCF) have gained popularity as an easy way to run code in a highly available, fault-tolerant serverless environment. What is Google Cloud Functions? Google Cloud Functions is a serverless compute service for creating and launching microservices.
As a leader in cloud infrastructure and platform services , the Google Cloud Platform is fast becoming an integral part of many enterprises’ cloud strategies. However, as businesses migrate to the Google Cloud Platform, they’re faced with even more complex, distributed environments that are inherently difficult to observe and operate.
In the webinar “ Intelligent Kubernetes observability and automation ,” Dynatrace expert Henrik Rexed and GCP experts Gari Singh and Alisha Stull provide insights into leveraging AI-powered observability and automation to gain granular insights into Kubernetes environments on Google Cloud Platform at an enterprise scale.
Cloud-native observability for Google’s fully managed GKE Autopilot clusters demands new methods of gathering metrics, traces, and logs for workloads, pods, and containers to enable better accessibility for operations teams. First, we create a small Kubernetes cluster in the Google Cloud Console.
In October 2021, Dynatrace announced the availability of the Dynatrace Software Intelligence Platform on Google Cloud as a software as a service (SaaS) solution. Dynatrace and Google Cloud play a critical role in helping customers accelerate their digital transformation initiatives. Instance-level visibility for GCP services.
Dynatrace industry-leading tracing, metrics, and log ingestion provide the level of high fidelity data that teams need to make accurate predictions about capacity. Such decisions must be attainable with little to no developer involvement in surfacing traces, metrics, and logs. Rapid OneAgent rollouts on Google Kubernetes Engine.
In IT and cloud computing, observability is the ability to measure a system’s current state based on the data it generates, such as logs, metrics, and traces. If you’ve read about observability, you likely know that collecting the measurements of logs, metrics, and distributed traces are the three key pillars to achieving success.
My goal was to provide IT teams with insights to optimize customer experience by collaborating with business teams, using both business KPIs and IT metrics. Google or Adobe Analytics). Automate smarter using actual customer experience metrics, not just server-side data.
The emerging concepts of working with DevOps metrics and DevOps KPIs have really come a long way. DevOps metrics to help you meet your DevOps goals. Like any IT or business project, you’ll need to track critical key metrics. Here are nine key DevOps metrics and DevOps KPIs that will help you be successful.
DevOps metrics and digital experience data are critical to this. Bringing teams together around DevOps metrics made it easier for M&B to identify how it could create better digital experiences for its customers and optimize revenue. Dynatrace news. Beginnings of BizDevOps.
Metrics matter. But without complex analytics to make sense of them in context, metrics are often too raw to be useful on their own. To achieve relevant insights, raw metrics typically need to be processed through filtering, aggregation, or arithmetic operations. Examples of metric calculations. Dynatrace news.
Recently introduced improvements to Visually complete and new web performance metrics for Real User Monitoring are now available for Synthetic Monitoring as well. Ensure better user experience with paint-focused performance metrics. These metrics are tightly connected to the perceived load speed of your application.
Metrics that offer measurable, repeatable insight into the user experience from the moment they arrive on a website from a mobile or desktop device. Great user experiences start with Core Web Vitals (CWVs) — a set of metrics defined by Google to help measure user experience at scale. When do these metrics matter?
Google has released a new book: The Site Reliability Workbook — Practical Ways to Implement SRE. David Rensin, a SRE at Google, says : It's a whole new book. In Chapter 4— Monitoring —there are examples of moving information from logs to metrics, improving both logs and metrics, and keeping logs as the data source.
Loosely defined, observability is the ability to understand what’s happening inside a system from the knowledge of the external data it produces, which are usually logs, metrics, and traces. Logs, metrics, and traces make up the bulk of all telemetry data. Then, Google made the OpenCensus project open source in 2018.
UK Home Office: Metrics Meets Service with Dimitris Perdikou Follow the Tech Transforms podcast Follow Tech Transforms on Twitter , LinkedIn , Instagram , and Facebook to get the latest updates on new episodes! Listen in to learn about the innovative steps that the USPTO has taken to develop new ways of working.
See into cloud blind spots Versatile, feature-rich cloud computing environments such as Amazon Web Services, Microsoft Azure, and Google Cloud Platform have been a game-changer, enabling DevOps teams to deliver greater capabilities on a wider scale.
Welcome back to the second part of our blog series on how easy it is to get enterprise-grade observability at scale in Dynatrace for your OpenTelemetry custom metrics. In Part 1 , we announced our new OpenTelemetry custom-metric exporters that provide the broadest language coverage on the market, including Go , .NET record(value); }.
We also explore how to improve user experiences within the Zero Trust framework and how to develop security metrics that eliminate DevSecOps bottlenecks. Episode 40 – Security Metrics: Measure Twice, Cut Once with Rick Stewart. Security Metrics: Measure Twice, Cut Once with Rick Stewart. Google Podcasts. Apple Podcasts.
To provide “quality signals that are essential to delivering a great user experience on the web,” Google introduced their Core Web Vitals initiative last year, advocating the Largest contentful paint , Cumulative layout shift , and First input delay metrics. by Google Core Web Vitals is?certainly?valuable,?it?leaves
Born in 2019 from the merger of the OpenCensus (Google Open Source) and OpenTracing (CNCF) projects, OpenTelemetry has become the de-facto standard for instrumenting, generating, collecting, and exporting telemetry data. Does Dynatrace support OpenTelemetry metrics? However, gRPC is not yet supported. Dynatrace tenant. Learn more.
I never thought I’d write an article in defence of DOMContentLoaded , but here it is… For many, many years now, performance engineers have been making a concerted effort to move away from technical metrics such as Load , and toward more user-facing, UX metrics such as Speed Index or Largest Contentful Paint. Or are they…?
Dynatrace Visually complete is a point-in-time web performance metric that measures when the visual area of a page has finished loading. Dynatrace is the only solution that provides these user experience metrics consistently for real user monitoring as well as for synthetic monitors. More precisely, you can now: . What you can achieve.
How To Monitor And Optimize Google Core Web Vitals How To Monitor And Optimize Google Core Web Vitals Matt Zeunert 2024-04-16T10:00:00+00:00 2024-04-16T12:05:36+00:00 This article is sponsored by DebugBear Google’s Core Web Vitals initiative has increased the attention website owners need to pay to user experience.
This is a potential cause for concern for anyone who cares about metrics like Largest Contentful Paint, which measures the largest visual element on a page – including videos. Core Web Vitals are a Google search ranking factor. Image size is another issue, as excessive image weight hurts your SEO ranking in Google Image Search.
Google’s Core Web Vitals initiative was launched in May of 2020 and, since then, its role in Search has morphed and evolved as roll-outs have been made and feedback has been received. However, to this day, messaging from Google can seem somewhat unclear and, in places, even contradictory. Don’t have time to read 5,500+ words?
Historically, I’d maybe look at Google Analytics—or a RUM solution if the client had one already—but this is only useful for showing me particular outliers, and not necessarily any patterns across the whole project. Any time you run a test with WebPageTest, you’ll get this table of different milestones and metrics. See entry 6.
You’ve fired up Google Lighthouse from Chrome’s DevTools because everyone and their uncle uses it to evaluate performance. Except, don’t — at least not using Google Lighthouse as your sole proof. Google Lighthouse is merely one tool in a complete performance toolkit. That’s what we’re aiming for, after all!
Annie leads the Chrome Speed Metrics team at Google, which has arguably had the most significant impact on web performance of the past decade. It's really important to acknowledge that none of this would have been possible without the great work from Annie and her small-but-mighty Speed Metrics team at Google.
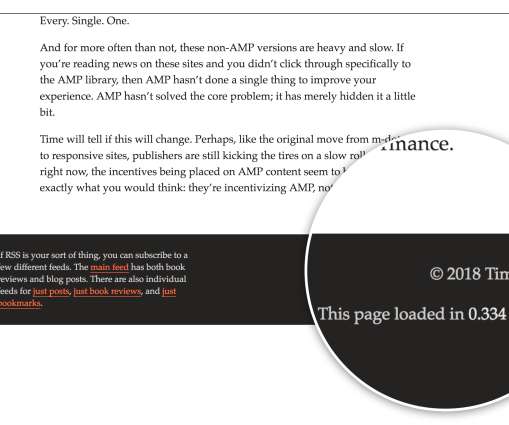
I was browsing Tim Kadlec’s website and I noticed he had added page load time metrics in the footer. If your browser supports the Paint Timing API you will see a couple of extra metrics: First Paint and First Contentful Paint. First Paint and First Contentful Paint Page load time is a metric that tells us part of the story.
When a page is slow to load, users are quick to abandon the site; research by Google , Vodafone , Akamai , and others has repeatedly shown that even small (~100 ms) degradations in page performance can increase abandonment, lost revenue, and lead to persistent changes in user behavior.
If you’re not familiar with Site Reliability Engineering (SRE) and the concepts of Service Level Indicators (SLIs), Service Level Objectives (SLOs) and Service Level Agreements (SLAs) I recommend watching the YouTube Video from Google Engineers called SLIs, SLOs, SLAs, oh my! class SRE implements DevOps) !
These functions are executed by a serverless platform or provider (such as AWS Lambda, Azure Functions or Google Cloud Functions) that manages the underlying infrastructure, scaling and billing. Observability is typically achieved by collecting three types of data from a system, metrics, logs and traces. Sign up for a free trial.
How To Use Google CrUX To Analyze And Compare The Performance Of JS Frameworks. How To Use Google CrUX To Analyze And Compare The Performance Of JS Frameworks. As I previously mentioned, my primary data source for this analysis is Google CrUX. Starting in June 2021, these metrics have become a ranking factor for Google search.
Web Performance is important for user experience and business metrics. Look, there are many case studies proving a correlation between loading time and business metrics!” ?-?I Using Test My Site from Think with Google : Gives you an estimation of potential revenue increase for your site when saving loading time.
Symptoms : No data is provided for affected metrics on dashboards, alerts, and custom device pages populated by the affected extension metrics. Linux: Google Container-Optimized OS 81 LTS. Linux: Google Container-Optimized OS 85 LTS. Linux: Google Container-Optimized OS 77 LTS. Extension logs display errors.
Just as people use Xerox as shorthand for paper copies and say “Google” instead of internet search, Docker has become synonymous with containers. An orchestration platform needs to expose data about its internal states and activities in the form of logs, events, metrics, or transaction traces. What is Docker? Observability.
And how can you verify this performance consistently across a multicloud environment that also uses Microsoft Azure and Google Cloud Platform frameworks? But how can you ensure that your applications meet these pillars and deliver the best outcomes for your business? which shows your operational efficiency in your software delivery pipeline.
By implementing service-level objectives, teams can avoid collecting and checking a huge amount of metrics for each service. According to Google’s SRE handbook , best practices, there are “ Four Golden Signals ” we can convert into four SLOs for services: reliability, latency, availability, and saturation.
At this year’s Perform, we are thrilled to have our three strategic cloud partners, Amazon Web Services (AWS), Microsoft Azure, and Google Cloud Platform (GCP), returning as both sponsors and presenters to share their expertise about cloud modernization and observability of generative AI models.
These UA campaigns typically feature static creatives, launch trailers, and game review videos on platforms like Google, Meta, and TikTok. The primary goals of these campaigns are to encourage more people to install and play the games, making incremental installs and engagement crucial metrics for evaluating their effectiveness.
A website needs to be constantly tested and optimized to be in line with Google's web and SEO guidelines. Core Web Vitals is a key performance metric that analyzes the website's performance by investigating the data and provides a strategic platform to scale up the website's user experience.
We organize all of the trending information in your field so you don't have to. Join 5,000+ users and stay up to date on the latest articles your peers are reading.
You know about us, now we want to get to know you!
Let's personalize your content
Let's get even more personalized
We recognize your account from another site in our network, please click 'Send Email' below to continue with verifying your account and setting a password.


Let's personalize your content