This site uses cookies to improve your experience. To help us insure we adhere to various privacy regulations, please select your country/region of residence. If you do not select a country, we will assume you are from the United States. Select your Cookie Settings or view our Privacy Policy and Terms of Use.
Cookie Settings
Cookies and similar technologies are used on this website for proper function of the website, for tracking performance analytics and for marketing purposes. We and some of our third-party providers may use cookie data for various purposes. Please review the cookie settings below and choose your preference.
Used for the proper function of the website
Used for monitoring website traffic and interactions
Cookie Settings
Cookies and similar technologies are used on this website for proper function of the website, for tracking performance analytics and for marketing purposes. We and some of our third-party providers may use cookie data for various purposes. Please review the cookie settings below and choose your preference.
Strictly Necessary: Used for the proper function of the website
Performance/Analytics: Used for monitoring website traffic and interactions
Enterprise networking is a radically different discipline in today’s microservices, containers, and Kubernetes paradigm than what it used to be in the old three-tier architecture world. Q: How Did Kubernetes Change the Networking Model? A: In many ways, Kubernetes networking is similar to our traditional networking.
By Alok Tiagi , Hariharan Ananthakrishnan , Ivan Porto Carrero and Keerti Lakshminarayan Netflix has developed a network observability sidecar called Flow Exporter that uses eBPF tracepoints to capture TCP flows at near real time. Without having network visibility, it’s difficult to improve our reliability, security and capacity posture.
These releases often assumed ideal conditions such as zero latency, infinite bandwidth, and no network loss, as highlighted in Peter Deutsch’s eight fallacies of distributed systems. Chaos engineering is a practice that extends beyond traditional failure testing by identifying unpredictable issues.
Constantly monitoring infrastructure health state and making ongoing optimizations are essential for Ops teams, SREs (site-reliability engineers), and IT admins. Quick and easy network infrastructure monitoring. Begin network monitoring by simply deploying an extension with just a few clicks. Virtual servers. Pool nodes.
The Dynatrace Software Intelligence Platform gives you a complete Infrastructure Monitoring solution for the monitoring of cloud platforms and virtual infrastructure, along with log monitoring and AIOps. Ensure high quality network traffic by tracking DNS requests out-of-the-box. Network services visibility (DNS, NTP, ActiveDirectory).
As cloud-native, distributed architectures proliferate, the need for DevOps technologies and DevOps platform engineers has increased as well. DevOps engineer tools can help ease the pressure as environment complexity grows. ” What does a DevOps platform engineer do? .” What are DevOps engineer tools and platforms.
Dynatrace provides server metrics monitoring in under five minutes, showing servers’ CPU, memory, and network health metrics all the way through to the process level, with no manual configuration necessary. Auto-detection starts monitoring new virtual machines as they are deployed. How does Dynatrace help?
This transition to public, private, and hybrid cloud is driving organizations to automate and virtualize IT operations to lower costs and optimize cloud processes and systems. Besides the traditional system hardware, storage, routers, and software, ITOps also includes virtual components of the network and cloud infrastructure.
Query your data with natural language Davis CoPilot is an excellent virtual assistant that helps you create queries using natural language. In our Dynatrace Dashboard tutorial, we want to add a chart that shows the bytes in and out per host over time to enhance visibility into network traffic. Looking for something?
Hardware virtualization for cloud computing has come a long way, improving performance using technologies such as VT-x, SR-IOV, VT-d, NVMe, and APICv. It's an exciting development in cloud computing: hardware virtualization is now fast. That's deliberate engineering: optimizing the most important workloads first.
Examples of such weaknesses are errors in application code, misconfigured network devices, and overly permissive access controls in a database. Network analysis looks for weaknesses within a network’s configurations and policies that would allow network access to unauthorized users. Identify vulnerabilities.
The latest batch of services cover databases, networks, machine learning and computing. Each service comes with zero-configuration, automatic instance detection, continuous data capture in context, and what’s most important – thanks to our AI engine Davis – is each service provides answers, not just data.
Dynatrace has added support for the newly introduced Amazon Virtual Private Cloud (VPC) Flow Logs for AWS Transit Gateway. This new service enhances the user visibility of network details with direct delivery of Flow Logs for Transit Gateway to your desired endpoint via Amazon Simple Storage Service (S3) bucket or Amazon CloudWatch Logs.
As a NetworkEngineer, you need to ensure the operational functionality, availability, efficiency, backup/recovery, and security of your company’s network. Exceeded throughput levels can be a sign that some changes to the network configuration might be required. Synthetic network monitoring. Events and alerts.
In the latest enhancements of Dynatrace Log Management and Analytics , Dynatrace extends coverage for Native Syslog support: Use Dynatrace ActiveGate to automatically add context and optimize network traffic to your Syslog messages. Still, an SLO’s quality lies in the significance of the underlying service-level indicator.
But managing the deployment, modification, networking, and scaling of multiple containers can quickly outstrip the capabilities of development and operations teams. This orchestration includes provisioning, scheduling, networking, ensuring availability, and monitoring container lifecycles. How does container orchestration work?
Without the ability to see the logs that are relevant to your service, infrastructure, or cloud function—at exactly the right time and in exactly the right format—your cloud or DevOps engineers lose the ability to find the root causes of the issues they troubleshoot. In some deployment scenarios, you might skip CloudWatch altogether.
VPC Flow Logs is an Amazon service that enables IT pros to capture information about the IP traffic that traverses network interfaces in a virtual private cloud, or VPC. By default, each record captures a network internet protocol (IP), a destination, and the source of the traffic flow that occurs within your environment.
Native support for Syslog messages Syslog messages are generated by default in Linux and Unix operating systems, security devices, network devices, and applications such as web servers and databases. Native support for syslog messages extends our infrastructure log support to all Linux/Unix systems and network devices.
Dynatrace VMware and virtualization documentation . All the monitoring data that’s captured by Dynatrace is analyzed by the Dynatrace AI engine, Davis, which has a full picture of your application and able to find the root cause of application problems, all the way down to the code-level. . OneAgent and its Operator .
In addition to providing visibility for core Azure services like virtual machines, load balancers, databases, and application services, we’re happy to announce support for the following 10 new Azure services, with many more to come soon: Virtual Machines (classic ones). Azure VirtualNetwork Gateways. Azure Batch.
It is worth pointing out that cloud processing is always subject to variable network conditions. Virtual Assembly Figure 3 describes how a virtual assembly of the encoded chunks replaces the physical assembly used in our previous architecture. MezzFS maintains a pool of upload buffers that correspond to a subset of these parts.
Redis, the #1 key-value store and top 10 database in the world, has grown by over 300% in popularity over that past 5 years, per the DB-Engines knowledge base. The demand for Redis is skyrocketing across dozens of use cases, particularly for cache, queues, geospatial data, and high speed transactions.
Dynatrace provides AWS Lambda metrics monitoring in less than five minutes, showing the function CPU, memory, and network health metrics all the way through to the process level. Auto-detection starts monitoring new virtual machines as they are deployed. Users can take advantage of the platform features immediately.
Nevertheless, there are related components and processes, for example, virtualization infrastructure and storage systems (see image below), that can lead to problems in your Kubernetes infrastructure. You haven’t detected that there’s a shortage of disk space on the virtualization host (or its shared storage). Conclusion.
There are three current underlying reasons for the platform engineering meme today. The virtualization and networking platform could be datacenter based, with something like VMware, or cloud based using one of the cloud providers such as AWS EC2. The second is that some companies with tools to sell are marketing the term.
Amazon Web Services (AWS) Outpost : This offering provides pre-configured hardware and software for customers to run native AWS computing, networking, and services on-premises in a cloud-native manner. This orchestration layer uses software-based tools to automate IT tasks and manage resources—virtualized or other.
With DEM solutions, organizations can operate over on-premise network infrastructure or private or public cloud SaaS or IaaS offerings. STM generates traffic that replicates the typical path or behavior of a user on a network to measure performance for example, response times, availability, packet loss, latency, jitter, and other variables).
While there are still quite a lot of cases where it is still applicable, it needs to evolve into more sophisticated processes tightly integrated with development and other parts of performance engineering. Data preparation and service virtualization functionality/tools would be here very handy here.
The first requirement toward automating monitoring is comprehensive observability across the network. As organizations adopt more technologies in their evolving multicloud networks, infrastructure monitoring has become much more complex. Out-of-the-box AIOps.
Unfortunately, container security is much more difficult to achieve than security for more traditional compute platforms, such as virtual machines or bare metal hosts. To function effectively, containers need to be able to communicate with each other and with network services. Network scanners. Let’s look at each type.
The process involves monitoring various components of the software delivery pipeline, including applications, infrastructure, networks, and databases. Infrastructure monitoring Infrastructure monitoring reviews servers, storage, network connections, virtual machines, and other data center elements that support applications.
These resources generate vast amounts of data in various locations, including containers, which can be virtual and ephemeral, thus more difficult to monitor. To gain insight into these problems, software engineers typically deploy application instrumentation frameworks that provide insight into applications and code.
Kubernetes (aka K8s) is an open-source platform used to run and manage containerized applications and services on clusters of physical or virtual machines across on-premises, public, private, and hybrid clouds. This virtualization makes it possible to efficiently deploy and securely run a container independently of the hosting infrastructure.
Dynatrace provides AWS Lambda metrics monitoring in under five minutes, showing the function CPU, memory, and network health metrics all the way through to the process level. Auto-detection starts monitoring new virtual machines as they are deployed. How does Dynatrace help?
Intelligent software automation can give organizations a competitive edge by analyzing historical and compute workload data in real time to automatically provision and deprovision virtual machines and Kubernetes. Investigate network systems and application security incidents quickly for near-real-time remediation. Application security.
Getting precise root cause analysis when dealing with several layers of virtualization in a containerized world. Using a data-driven approach to size Azure resources, Dynatrace OneAgent captures host metrics out-of-the-box to assess CPU, memory, and network utilization on a VM host. Too much data requested from a database.
Application security is a software engineering term that refers to several different types of security practices designed to ensure applications do not contain vulnerabilities that could allow illicit access to sensitive data, unauthorized code modification, or resource hijacking. Dynatrace news. So, why is all this important?
It aims to provide a reliable platform for users to participate in live or pre-recorded workout sessions, virtual training, or fitness tutorials without interruptions. Fitness app : The fitness app should support a concurrent user count of 10,000 during virtual fitness events or live-streaming sessions.
In recognition of partner architects, engineers, administrators, consultants, and delivery roles that invest in formal Dynatrace training and certification, we launched Pro Club as an exclusive community for those who achieve Dynatrace Professional certification. Partner Pro Club.
Organizations everywhere are adopting site reliability engineering (SRE) to cope with the growing complexity of hybrid and cloud-native environments. Virtualization has revolutionized system administration by making it possible for software to manage systems, storage, and networks. Dynatrace news.
In recognition of partner architects, engineers, administrators, consultants, and delivery roles that invest in formal Dynatrace training and certification, we launched Pro Club as an exclusive community for those who achieve Dynatrace Professional certification. Partner Pro Club.
The Dynatrace Software Intelligence Platform gives you a complete Infrastructure Monitoring solution for monitoring cloud platforms and virtual infrastructure, along with log monitoring and AIOps. Is it the WSO2-AM gateway itself, a networking issue, a sudden increase in demand, or something else entirely? But where does the fault lie?
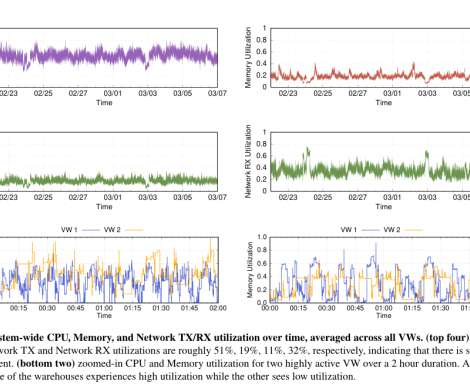
Building an elastic query engine on disaggregated storage , Vuppalapati, NSDI’20. Tenant isolation is achieved by provisioning a separate virtual warehouse (VW) for each tenant. A virtual warehouse comprises a set of compute nodes, and compute elasticity is achieved by adding or removing nodes on an on-demand basis.
We organize all of the trending information in your field so you don't have to. Join 5,000+ users and stay up to date on the latest articles your peers are reading.
You know about us, now we want to get to know you!
Let's personalize your content
Let's get even more personalized
We recognize your account from another site in our network, please click 'Send Email' below to continue with verifying your account and setting a password.


Let's personalize your content