This site uses cookies to improve your experience. To help us insure we adhere to various privacy regulations, please select your country/region of residence. If you do not select a country, we will assume you are from the United States. Select your Cookie Settings or view our Privacy Policy and Terms of Use.
Cookie Settings
Cookies and similar technologies are used on this website for proper function of the website, for tracking performance analytics and for marketing purposes. We and some of our third-party providers may use cookie data for various purposes. Please review the cookie settings below and choose your preference.
Used for the proper function of the website
Used for monitoring website traffic and interactions
Cookie Settings
Cookies and similar technologies are used on this website for proper function of the website, for tracking performance analytics and for marketing purposes. We and some of our third-party providers may use cookie data for various purposes. Please review the cookie settings below and choose your preference.
Strictly Necessary: Used for the proper function of the website
Performance/Analytics: Used for monitoring website traffic and interactions
This article is the first in a multi-part series sharing a breadth of Analytics Engineering work at Netflix, recently presented as part of our annual internal Analytics Engineering conference. Subsequent posts will detail examples of exciting analytic engineering domain applications and aspects of the technical craft.
The problems with degraded service availability along with revenue impact occur mainly because of Kubernetes pod crashes along with resource exhaustion and network disruptions that hit during peak shopping seasons.
By Alok Tiagi , Hariharan Ananthakrishnan , Ivan Porto Carrero and Keerti Lakshminarayan Netflix has developed a network observability sidecar called Flow Exporter that uses eBPF tracepoints to capture TCP flows at near real time. Without having network visibility, it’s difficult to improve our reliability, security and capacity posture.
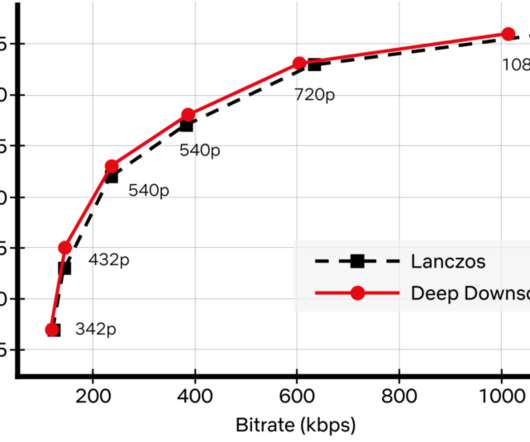
Recently, we added another powerful tool to our arsenal: neural networks for video downscaling. In this tech blog, we describe how we improved Netflix video quality with neural networks, the challenges we faced and what lies ahead. How can neural networks fit into Netflix video encoding?
Enterprise networking is a radically different discipline in today’s microservices, containers, and Kubernetes paradigm than what it used to be in the old three-tier architecture world. Q: How Did Kubernetes Change the Networking Model? A: In many ways, Kubernetes networking is similar to our traditional networking.
Google has a pretty tight grip on the tech industry: it makes by far the most popular browser with the best DevTools, and the most popular search engine, which means that web developers spend most of their time in Chrome, most of their visitors are in Chrome, and a lot of their search traffic will be coming from Google. somewhere sensible.
JMeter Netconf Plug-in and Network Service Automation. Network service automation-related requirements are usually realized by means of commercial or open-source network orchestrator or controller software system. JMeter Netconf plug-in implementation includes two modules.
These releases often assumed ideal conditions such as zero latency, infinite bandwidth, and no network loss, as highlighted in Peter Deutsch’s eight fallacies of distributed systems. Chaos engineering is a practice that extends beyond traditional failure testing by identifying unpredictable issues.
With all the data collected and powered by our Davis AI-driven causation engine, Dynatrace automatically identifies slowdowns in your applications and services and points you to their root cause. Ensure high quality network traffic by tracking DNS requests out-of-the-box. Network services visibility (DNS, NTP, ActiveDirectory).
These ready-made dashboards offer your platform engineers, who oversee Kubernetes environments, immediate and comprehensive data visibility. This allows platform engineers to focus on high-value tasks like resolving issues and optimizing performance rather than spending time on data discovery and exploration.
But chaos engineering stands out for its exceptional capacity to identify weaknesses and proactively fortify systems. Businesses rely heavily on intricate systems and networks to run effectively in today's technology-driven world.
Constantly monitoring infrastructure health state and making ongoing optimizations are essential for Ops teams, SREs (site-reliability engineers), and IT admins. Quick and easy network infrastructure monitoring. Begin network monitoring by simply deploying an extension with just a few clicks. Start monitoring in minutes.
As cloud-native, distributed architectures proliferate, the need for DevOps technologies and DevOps platform engineers has increased as well. DevOps engineer tools can help ease the pressure as environment complexity grows. ” What does a DevOps platform engineer do? .” What are DevOps engineer tools and platforms.
For cloud operations teams, network performance monitoring is central in ensuring application and infrastructure performance. If the network is sluggish, an application may also be slow, frustrating users. Worse, a malicious attacker may gain access to the network, compromising sensitive application data.
Our engineering team and Creative Technologies sound expert joined forces to quickly solve the issue, but a larger conversation about higher quality audio continued. This approach selects the audio bitrate based on network conditions at the start of playback. channel stream, as well as audible degradation of high frequencies.
Various factors, such as network communication, inter-service dependencies, external dependencies, and scalability issues, can contribute to outages. The scalability, agility, and continuous delivery offered by microservices architecture make it a popular option for businesses today.
Why browser and HTTP monitors might not be sufficient In modern IT environments, which are complex and dynamically changing, you often need deeper insights into the Transport or Network layers. Is it a bug in the codebase, a malfunctioning backend service, an overloaded hosting infrastructure, or perhaps a misconfigured network?
Monitoring modern IT infrastructure is difficult, sometimes impossible, without advanced network monitoring tools. While the market is saturated with many Network Administrator support solutions, Dynatrace can help you analyze the impact on your organization in an automated manner. Sample SNMP-enabled device configuration. What’s next?
When 54 percent of the internet traffic share is accounted for by Mobile , it's certainly nontrivial to acknowledge how your app can make a difference to that of the competitor!
By Abhinaya Shetty , Bharath Mummadisetty At Netflix, our Membership and Finance Data Engineering team harnesses diverse data related to plans, pricing, membership life cycle, and revenue to fuel analytics, power various dashboards, and make data-informed decisions. Our audits would detect this and alert the on-call data engineer (DE).
Business-focused, unified platform approach : A unified platform approach enables platform engineering and self-service portals, simplifying operations and reducing costs. Davis, the causal AI engine, instantly identifies root causes and predicts service degradation before it impacts users.
By Cheng Xie , Bryan Shultz , and Christine Xu In a previous blog post , we described how Netflix uses eBPF to capture TCP flow logs at scale for enhanced network insights. Conclusion With misattribution solved, eBPF flow logs now deliver dependable, fleet-wide insights into Netflixs service topology and network health.
It now fully supports not only Network Availability Monitors but also HTTP synthetic monitors. Thanks to the power of Grail, those details are available for all executions stored for the entire retention period during which synthetic results are kept. The new Dynatrace Synthetic app allows you to analyze these results.
For busy site reliability engineers, ensuring system reliability, scalability, and overall health is an imperative that’s getting harder to achieve in ever-expanding, cloud-native, container-based environments. Because of its adaptability, Prometheus has become an essential tool for observability engineering. Jolly good!
One such open-source, distributed search and analytics engine is Elasticsearch, which is very efficient at handling data in large sets and high-velocity queries. This extra network overhead will easily result in increased latency compared to a single-node architecture where data access is straightforward.
Such fragmented approaches fall short of giving teams the insights they need to run IT and site reliability engineering operations effectively. Get to the root cause of issues Most AI today uses machine learning models like neural networks that find correlations and make predictions based on them.
BGP provides network stability as it guarantees routers can rapidly adapt to send packets via a different connection if one Internet pathway goes down. The original function of BGP was to carry internet reachability information between edge routers (it is sometimes described as a reachability protocol).
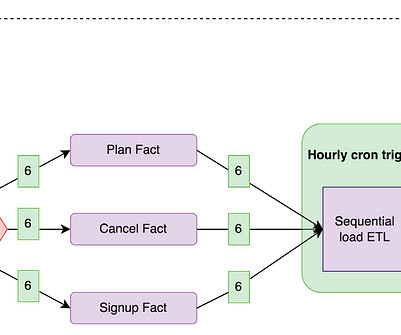
Growth Engineering at Netflix?—?Automated In the Growth Engineering team, we refer to this as the top of the signup funnel. For more background on the signup funnel and Growth Engineering’s role in the signup funnel, please read our initial post on the topic: Growth Engineering at Netflix? Growth Engineering at Netflix?—?Automated
Data engineering projects often require the setup and management of complex infrastructures that support data processing, storage, and analysis. In this article, we will explore the benefits of leveraging IaC for data engineering projects and provide detailed implementation steps to get started.
For two decades, Dynatrace NAM—Network Application Monitoring, formerly known as DC RUM—has been successfully monitoring the user experience of our customers’ enterprise applications. SNMP managed the costs of network links well, but not the sources of those costs (i.e., Dynatrace news. Performance has always mattered.
Machine Learning Engineer at Amazon and has led several machine-learning initiatives across the Amazon ecosystem. FUN FACT : In this talk , Rodrigo Schmidt, director of engineering at Instagram talks about the different challenges they have faced in scaling the data infrastructure at Instagram. This is a guest post by Ankit Sirmorya.
This means a system that is not merely available but is also engineered with extensive redundant measures to continue to work as its users expect. reliability situations, where continuity of service is essential, with redundant elements continuously in-service, such as with airplane engines. This ensures reliability.
Open Connect Open Connect is Netflix’s content delivery network (CDN). video streaming) takes place in the Open Connect network. The network devices that underlie a large portion of the CDN are mostly managed by Python applications. If any of this interests you, check out the jobs site or find us at PyCon. are you logged in?
For system administrators, operations engineers, and others with strong systems and software backgrounds, there’s perhaps no better time than the present to transition into DevOps. Interviews can range from standard software engineer coding questions to questions on system design, Linux debugging, and DevOps tools.
For example, if you’re monitoring network traffic and the average over the past 7 days is 500 Mbps, the threshold will adapt to this baseline. An anomaly will be identified if traffic suddenly drops below 200 Mbps or above 800 Mbps, helping you identify unusual spikes or drops.
Intro to Istio Observability Using Prometheus Istio service mesh abstracts the network from the application layers using sidecar proxies. You can implement security and advance networking policies to all the communication across your infrastructure using Istio. But another important feature of Istio is observability.
Host Monitoring dashboards offer real-time visibility into the health and performance of servers and network infrastructure, enabling proactive issue detection and resolution. This information is crucial for identifying network issues, troubleshooting connectivity problems, and ensuring reliable domain name resolution.
As a NetworkEngineer, you need to ensure the operational functionality, availability, efficiency, backup/recovery, and security of your company’s network. Exceeded throughput levels can be a sign that some changes to the network configuration might be required. Synthetic network monitoring. Events and alerts.
There are three current underlying reasons for the platform engineering meme today. The virtualization and networking platform could be datacenter based, with something like VMware, or cloud based using one of the cloud providers such as AWS EC2. The second is that some companies with tools to sell are marketing the term.
This new service enhances the user visibility of network details with direct delivery of Flow Logs for Transit Gateway to your desired endpoint via Amazon Simple Storage Service (S3) bucket or Amazon CloudWatch Logs. AWS Transit Gateway is a service offering from Amazon Web Services that connects network resources via a centralized hub.
Running containers : Docker Engine is a container runtime that runs in almost any environment: Mac and Windows PCs, Linux and Windows servers, the cloud, and on edge devices. Docker Engine is built on top containerd , the leading open-source container runtime, a project of the Cloud Native Computing Foundation (DNCF). Networking.
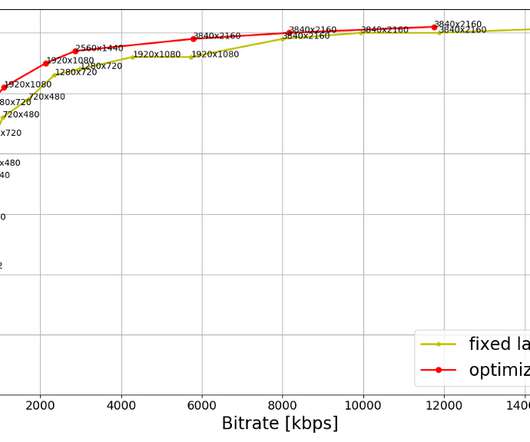
As the number of 4K titles in our catalog continues to grow and more devices support the premium features, we expect these video streams to have an increasing impact on our members and the network. The fixed-bitrate ladder starts at 560 kbps which may be too high for some cellular networks. shot-optimized encoding and 4K VMAF model ?—?and
But managing the deployment, modification, networking, and scaling of multiple containers can quickly outstrip the capabilities of development and operations teams. This orchestration includes provisioning, scheduling, networking, ensuring availability, and monitoring container lifecycles. How does container orchestration work?
The latest batch of services cover databases, networks, machine learning and computing. Each service comes with zero-configuration, automatic instance detection, continuous data capture in context, and what’s most important – thanks to our AI engine Davis – is each service provides answers, not just data.
We organize all of the trending information in your field so you don't have to. Join 5,000+ users and stay up to date on the latest articles your peers are reading.
You know about us, now we want to get to know you!
Let's personalize your content
Let's get even more personalized
We recognize your account from another site in our network, please click 'Send Email' below to continue with verifying your account and setting a password.


Let's personalize your content