This site uses cookies to improve your experience. To help us insure we adhere to various privacy regulations, please select your country/region of residence. If you do not select a country, we will assume you are from the United States. Select your Cookie Settings or view our Privacy Policy and Terms of Use.
Cookie Settings
Cookies and similar technologies are used on this website for proper function of the website, for tracking performance analytics and for marketing purposes. We and some of our third-party providers may use cookie data for various purposes. Please review the cookie settings below and choose your preference.
Used for the proper function of the website
Used for monitoring website traffic and interactions
Cookie Settings
Cookies and similar technologies are used on this website for proper function of the website, for tracking performance analytics and for marketing purposes. We and some of our third-party providers may use cookie data for various purposes. Please review the cookie settings below and choose your preference.
Strictly Necessary: Used for the proper function of the website
Performance/Analytics: Used for monitoring website traffic and interactions
By Alok Tiagi , Hariharan Ananthakrishnan , Ivan Porto Carrero and Keerti Lakshminarayan Netflix has developed a network observability sidecar called Flow Exporter that uses eBPF tracepoints to capture TCP flows at near real time. Without having network visibility, it’s difficult to improve our reliability, security and capacity posture.
By minimizing bandwidth and preventing unrelated traffic between data centers, you can maintain healthy network infrastructure and save on costs. Dynatrace network zones provide an easy means of routing OneAgent traffic between data centers using a unique approach that separates Dynatrace from its competitors.
Host Monitoring dashboards offer real-time visibility into the health and performance of servers and network infrastructure, enabling proactive issue detection and resolution. This information is crucial for identifying network issues, troubleshooting connectivity problems, and ensuring reliable domain name resolution.
Kafka scales efficiently for large data workloads, while RabbitMQ provides strong message durability and precise control over message delivery. Message brokers handle validation, routing, storage, and delivery, ensuring efficient and reliable communication. This allows Kafka clusters to handle high-throughput workloads efficiently.
This guide will cover how to distribute workloads across multiple nodes, set up efficient clustering, and implement robust load-balancing techniques. They can be mirrored and configured for either availability or consistency, providing different strategies for managing network partitions.
For example, let’s say you have an idea for a new social network and decide to use Kubernetes as your container management platform. Unexpectedly, a famous influencer notices your social network and promotes it all over their other channels. Dynatrace’s PVCs extension enables you to make efficient use of your resources.
In addition, with 193M members and counting, there is a huge diversity in the networks that stream our content as well as in our members’ bandwidth. It is, thus, imperative that we are sensible in the use of the network and of the bandwidth we require. and thus fall back to less efficient encode families.
Our goal was to build a versatile and efficient data storage solution that could handle a wide variety of use cases, ranging from the simplest hashmaps to more complex data structures, all while ensuring high availability, tunable consistency, and low latency. Cassandra), ensuring fast and efficient access.
by Liwei Guo , Ashwin Kumar Gopi Valliammal , Raymond Tam , Chris Pham , Agata Opalach , Weibo Ni AV1 is the first high-efficiency video codec format with a royalty-free license from Alliance of Open Media (AOMedia), made possible by wide-ranging industry commitment of expertise and resources.
A log is a detailed, timestamped record of an event generated by an operating system, computing environment, application, server, or network device. Log analytics also help identify ways to make infrastructure environments more predictable, efficient, and resilient. Together, they provide continuous value to the business.
In addition, pySpark applications can be tuned to optimize performance and achieve better execution time, scalability, and resource utilization. In this article, we will discuss some tips and techniques for tuning PySpark applications. This can significantly reduce network overhead and improve performance.
Well-Architected Reviews are conducted by AWS customers and AWS Partner Network (APN) Partners to evaluate architectures to understand how well applications align with the multiple Well-Architected Framework design principles and best practices. Stay tuned. AWS 5-pillars. Fully conceptualizing capacity requirements.
For a deeper look into how to gain end-to-end observability into Kubernetes environments, tune into the on-demand webinar Harness the Power of Kubernetes Observability. The “scheduler” determines the placement of new containers so compute resources are used most efficiently. Networking. Watch webinar now!
We expect these bitrates to evolve over time as we get more efficient with our encoding techniques. This approach selects the audio bitrate based on network conditions at the start of playback. Adaptive streaming is a technology designed to deliver media to the user in the most optimal way for their network connection.
Automation and analysis features, in particular, have boosted operational efficiency and performance by tracking and responding to complex or information-dense situations. Explainable AI tools and practices are important for understanding and weeding out biases like this to improve output accuracy and operational efficiency.
Open Connect Open Connect is Netflix’s content delivery network (CDN). video streaming) takes place in the Open Connect network. The network devices that underlie a large portion of the CDN are mostly managed by Python applications. If any of this interests you, check out the jobs site or find us at PyCon. are you logged in?
But outdated security practices pose a significant barrier even to the most efficient DevOps initiatives. We looked at a hosts network devices, the flows between them and then at the process level details. Modern DevOps permits high velocity development cycles resulting in weekly, daily, or even hourly software releases.
Snap: a microkernel approach to host networking Marty et al., This paper describes the networking stack, Snap , that has been running in production at Google for the last three years+. The desire for CPU efficiency and lower latencies is easy to understand. SOSP’19. Emphasis mine). It reminds me of ZeroMQ.
Azure Network Interface. Azure Data Factory is a hybrid data integration service that enables you to quickly and efficiently create automated data pipelines—without writing any code. We’ll release additional monitoring support for new services soon, so stay tuned for further updates. Azure Data Factory v1. Azure Data Factory v2.
Like most IT professionals, Harikrishnan and the Parker team’s cybersecurity engineer Tom Hood have multiple requirements to manage, from implementing digital transformation and ensuring operational efficiency to securing IT systems. What device are they using over what type of network? Efficiency. Accessibility.
Building on these foundational abstractions, we developed the TimeSeries Abstraction — a versatile and scalable solution designed to efficiently store and query large volumes of temporal event data with low millisecond latencies, all in a cost-effective manner across various use cases. Let’s dive into the various aspects of this abstraction.
Digital experience monitoring enables companies to respond to issues more efficiently in real time, and, through enrichment with the right business data, understand how end-user experience of their digital products significantly affects business key performance indicators (KPIs). One of the key advantages of DEM is its versatility.
Deployment frequency measures both long-term and short-term efficiency. For example, by measuring deployment frequency daily or weekly, you can determine how efficiently your team is responding to process changes. This metric gauges the stability and efficiency of your DevOps processes.
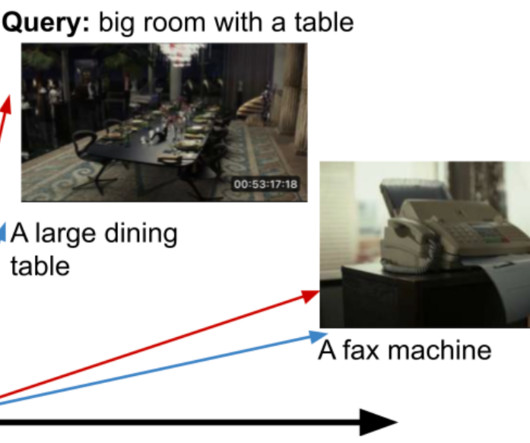
To train these parameters as well as fine-tune the pretrained image-text model weights, we leverage in-house datasets that pair shots of varying durations with rich textual descriptions of their content. The embedding computation is based on a large neural network model and has to be run on GPUs for optimal throughput.
The application is a combination of neural embeddings , which encode the semantic information in words and sentences, and locality sensitive hashing , which efficiently assigns approximately nearby items to the same buckets and faraway items to different buckets. 0.3, -0.5, -0.7, and “problem authenticating” might be [0.1, 0.35, -0.5, -0.7,
Figure 1: A Simplified Video Processing Pipeline With this architecture, chunk encoding is very efficient and processed in distributed cloud computing instances. It is worth pointing out that cloud processing is always subject to variable network conditions.
Reconstructing a streaming session was a tedious and time consuming process that involved tracing all interactions (requests) between the Netflix app, our Content Delivery Network (CDN), and backend microservices. Our engineering teams tuned their services for performance after factoring in increased resource utilization due to tracing.
We built AutoOptimize to efficiently and transparently optimize the data and metadata storage layout while maximizing their cost and performance benefits. This article will list some of the use cases of AutoOptimize, discuss the design principles that help enhance efficiency, and present the high-level architecture.
This challenge has given rise to the discipline of observability engineering, which concentrates on the details of telemetry data to fine-tune observability use cases. But often, we use additional services and solutions within our environment for backups, storage, networking, and more. Please stay tuned!
With these clear benefits, we continued to build out this functionality for more devices, enabling the same efficiency wins. It was very efficient, but it had a set job size, requiring manual intervention if we wanted to horizontally scale it, and it required manual intervention when rolling out a new version.
A practical solution is Berkeley Packet Filter (BPF), a highly flexible, efficient virtual machine that runs in the Linux kernel. BPF is mainly used for networking, tracing, and security. Of all the kinds of failures, kernel failures may be the most difficult to analyze and simulate.
So many false starts, tedious workflows, and a complete lack of efficiency really made it difficult for me to find momentum. For now, I’m usually sat with a coffee, some tunes on, and an old-school pen and paper making notes. against many other metrics as other milestones (except CLS) are network-bound and TBT is CPU-bound.
Indexes are generally considered to be the panacea when it comes to SQL performance tuning, and PostgreSQL supports different types of indexes catering to different use cases. I keep seeing many articles and talks on “tuning” discussing how creating new indexes speeds up SQL but rarely ones discussing removing them.
The results will help database administrators and decision-makers choose the right platform for their performance, scalability, and cost-efficiency needs. However, to ensure a level playing field regarding connection handling, we tuned ScaleGrid’s instances to allow 830 connections. </p>
Also, in place of expensive retraining or fine-tuning for an LLM, this approach allows for quick data updates at low cost. This latter approach with node embeddings can be more robust and potentially more efficient. One more embellishment is to use a graph neural network (GNN) trained on the documents.
My last talk for 2017 was at AWS re:Invent, on "How Netflix Tunes EC2 Instances for Performance," an updated version of my [2014] talk. Our team looks after the BaseAMI, kernel tuning, OS performance tools and profilers, and self-service tools like Vector. Networking. We help where we can. File System. Storage I/O.
My last talk for 2017 was at AWS re:Invent, on "How Netflix Tunes EC2 Instances for Performance," an updated version of my [2014] talk. Our team looks after the BaseAMI, kernel tuning, OS performance tools and profilers, and self-service tools like Vector. Networking. We help where we can. File System. Storage I/O.
Moving away from the use of dedicated instances that were constrained in quantity, we tapped into Netflix’s internal trough created due to autoscaling microservices, leading to significant improvements in computation elasticity as well as resource utilization efficiency. depending on the use case.
Learn how RabbitMQ can boost your system’s efficiency and reliability in these practical scenarios. Understanding RabbitMQ as a Message Broker RabbitMQ is a powerful message broker that enables applications to communicate by efficiently directing messages from producers to their intended consumers.
Another configuration we can use to increase the efficiency of parallel execution on the slaves is to tune binlog_group_commit_sync_delay on the master. The theorem states that, in the presence of a network partition, we will have to choose either availability or consistency, but not both. Stay tuned!!
This result s in w eb – service integrations perforat ing firewalls, network content not being captured by intrusion detection and vulnerability scanners miss ing what’s running in production. . One single platform drives efficient DevSecOps collaboration and automated vulnerability management.
Importance of Managing and Scaling Distributed SQL Databases Managing and growing distributed SQL databases is important for modern businesses to work efficiently and stay agile. Tools and Techniques for Scaling Distributed SQL Databases Several tools and techniques facilitate the efficient scaling of distributed SQL databases.
Understanding Redis Performance Indicators Redis is designed to handle high traffic and low latency with its in-memory data store and efficient data structures. Evaluating factors like hit rate, which assesses cache efficiency level, or tracking key evictions from the cache are also essential elements during the Redis monitoring process.
Getting fast initial render with streaming server-side rendering, efficient component-level updates and state transitions, while also setting up a performant loading and bundling strategy for all the assets is hard and time-consuming technical work. Stay tuned for more in 2022! Oxygen is in early access preview with select merchants.
We organize all of the trending information in your field so you don't have to. Join 5,000+ users and stay up to date on the latest articles your peers are reading.
You know about us, now we want to get to know you!
Let's personalize your content
Let's get even more personalized
We recognize your account from another site in our network, please click 'Send Email' below to continue with verifying your account and setting a password.


Let's personalize your content